Global Wig Export Analysis from 2010 to 2012
Global Wig Export Value Annual Trend from 2010 to 2012
Export Value (Thousand USD) year on year
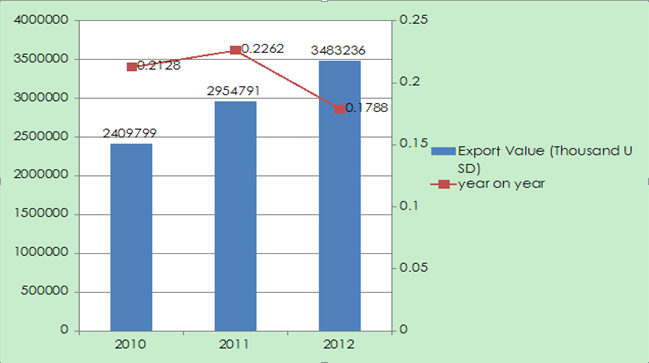
The export value of global wigs from 2010 to 2012 increased year by year. The total export value of global wigs was 2.41 billion US dollars, 2.955 billion US dollars and 3.483 billion US dollars from 2010 to 2012, with an increase of 21.28%, 22.62% and 17.88% separately. The export value of 2012 increased by 44.54% compared to that of 2010.
Global Wig Export Market from 2010 to 2012
| NO. | Country/Region | Export Value (Thousand USD) | Growth Compared 2012 to 2010 | ||
|
|
| 2010 | 2011 | 2012 |
|
|
| Global | 2,409,799 | 2,954,791 | 3,483,236 | 44.54% |
| 1 | China | 1,843,559 | 2,260,050 | 2,696,568 | 46.27% |
| 2 | Indonesia | 196,719 | 246,393 | 270,780 | 37.65% |
| 3 | Hong Kong | 79,803 | 84,010 | 89,078 | 11.62% |
| 4 | USA | 43,098 | 49,337 | 56,472 | 31.03% |
| 5 | Philippines | 20,773 | 34,492 | 54,702 | 163.33% |
| 6 | Republic of Korea | 39,317 | 49,374 | 47,610 | 21.09% |
| 7 | Germany | 32,552 | 39,515 | 42,549 | 30.71% |
| 8 | Italy | 22,085 | 24,433 | 23,360 | 5.77% |
| 9 | Vietnam | 4,041 | 5,150 | 22,884 | 466.30% |
| 10 | Thailand | 23,909 | 21,904 | 21,635 | -9.51% |
Global Wig Export Market Share from 2010 to 2012
| NO. | Country/Region | Export Value Percentage | ||
| 2010 | 2011 | 2012 | ||
| 1 | China | 76.50% | 76.49% | 77.42% |
| 2 | Indonesia | 8.16% | 8.34% | 7.77% |
| 3 | Hong Kong | 3.31% | 2.84% | 2.56% |
| 4 | USA | 1.79% | 1.67% | 1.62% |
| 5 | Philippines | 0.86% | 1.17% | 1.57% |
| 6 | Republic of Korea | 1.63% | 1.67% | 1.37% |
| 7 | Germany | 1.35% | 1.34% | 1.22% |
| 8 | Italy | 0.92% | 0.83% | 0.67% |
| 9 | Vietnam | 0.17% | 0.17% | 0.66% |
| 10 | Thailand | 0.99% | 0.74% | 0.62% |
Wigs’ main exporting countries/regions are China, Indonesia and Hong Kong, and the export value of the three countries/regions accounted for 87.75% of the global total export value. Among the top ten exporting markets from 2010 to 2012, the export value of Vietnam and the Philippines increased the fastest by 466.30% and 163.33% separately.
China is the world's most important exporter of wigs, global more than 3/4 wigs are imported from China and the industry exporting source areas are highly concentrated. China's export value of wigs in 2012 increased by 46.27% compared to 2010 (the increase is slightly higher than the global wig export value growth), which amounted to 2.697 billion US dollars, accounting for 77.42% of global total export value of 2012.
Global Wig Industry Export Products Distribution from 2010 to 2012
| Product Name | Export Value (Thousand USD) | ||
| 2010 | 2011 | 2012 | |
| Wig | 2,409,799 | 2,954,791 | 3,483,236 |
| Wigs of Human Hair | 1,026,557 | 1,180,107 | 1,376,135 |
| Wigs of Other Materials | 707,124 | 1,006,599 | 1,123,493 |
| Wigs of Synthetic Materials | 355,944 | 394,799 | 571,852 |
| Complete Wigs of Synthetic Materials | 320,159 | 373,279 | 411,739 |
Wigs of human hair occupied the highest proportion among the wig products. 39.51% of the export wigs in 2012 were made of human hair, and the export value of wigs of other materials accounted for 32.25% of the total export value of wigs. The export value of wigs of synthetic materials and complete wigs of synthetic materials accounted for 16.42% and 11.82% respectively.
Global Complete Wigs of Synthetic Materials Export Analysis from 2010 to 2012
Global Complete Wigs of Synthetic Materials Export Market from 2010 to 2012
| NO. | Country/Region | Export Value (Thousand USD) | Growth Compared 2012 to 2010 | ||
| 2010 | 2011 | 2012 | |||
|
| Global | 320,159 | 373,279 | 411,739 | 28.60% |
| 1 | China | 133,701 | 154,142 | 176,415 | 31.95% |
| 2 | Indonesia | 86,161 | 100,346 | 91,554 | 6.26% |
| 3 | Philippines | 20,766 | 34,491 | 54,689 | 163.36% |
| 4 | Hong Kong | 25,954 | 27,442 | 30,538 | 17.66% |
| 5 | Germany | 17,265 | 21,501 | 22,742 | 31.72% |
| 6 | USA | 8,644 | 10,354 | 10,224 | 18.28% |
| 7 | Thailand | 9,045 | 6,472 | 4,767 | -47.30% |
| 8 | UK | 3,917 | 4,168 | 3,903 | -0.36% |
| 9 | France | 3,091 | 3,114 | 3,073 | -0.58% |
| 10 | Vietnam | 838 | 788 | 2,948 | 251.79% |
Global Complete Wigs of Synthetic Materials Export Market Share from 2010 to 2012
| NO. | Country/Region | Export Value Percentage | ||
| 2010 | 2011 | 2012 | ||
| 1 | China | 41.76% | 41.29% | 42.85% |
| 2 | Indonesia | 26.91% | 26.88% | 22.24% |
| 3 | Philippines | 6.49% | 9.24% | 13.28% |
| 4 | Hong Kong | 8.11% | 7.35% | 7.42% |
| 5 | Germany | 5.39% | 5.76% | 5.52% |
| 6 | USA | 2.70% | 2.77% | 2.48% |
| 7 | Thailand | 2.83% | 1.73% | 1.16% |
| 8 | UK | 1.22% | 1.12% | 0.95% |
| 9 | France | 0.97% | 0.83% | 0.75% |
| 10 | Vietnam | 0.26% | 0.21% | 0.72% |
The total export value of global complete wigs of synthetic materials reached to 320 million US dollars, 373 million US dollars and 412 million US dollars respectively from 2010 to 2012. The export value of 2012 increased by 28.60% compared to 2010.
Complete wigs of synthetic materials' main exporting countries are China, Indonesia and the Philippines and the export value of the three countries/regions accounted for 78.37% of the global total export value. Among the top ten exporting markets from 2010 to 2012, the export value of Vietnam and the Philippines increased the fastest by 251.79% and 163.36% separately.
China is the world's most important exporter of complete wigs of synthetic materials, global more than 40% complete wigs of synthetic materials are imported from China and the industry exporting source areas are highly concentrated. China's export value of complete wigs of synthetic materials in 2012 increased by 31.95% compared to 2010 (the increase is slightly higher than the global wig export value growth, which is 28.60%), which amounted to 176 million US dollars, accounting for 42.85% of global total export value of 2012.
Global Wigs of Synthetic Materials Export Analysis from 2010 to 2012
Global Wigs of Synthetic Materials Export Market from 2010 to 2012
| NO. | Country/Region | Export Value (Thousand USD) | Growth Compared 2012 to 2010 | ||
| 2010 | 2011 | 2012 | |||
|
| Global | 355,944 | 394,799 | 571,852 | 60.66% |
| 1 | China | 194,391 | 200,743 | 311,346 | 60.16% |
| 2 | Indonesia | 46,451 | 61,827 | 81,658 | 75.79% |
| 3 | Republic of Korea | 25,096 | 26,807 | 31,617 | 25.98% |
| 4 | Togo | 8,464 | 12,078 | 18,281 | 115.99% |
| 5 | Vietnam | 2,326 | 3,192 | 16,979 | 629.97% |
| 6 | Canada | 17,420 | 17,779 | 16,466 | -5.48% |
| 7 | USA | 11,427 | 9,422 | 15,068 | 31.86% |
| 8 | Senegal | 3,316 | 2,768 | 10,601 | 219.69% |
| 9 | Bangladesh | 299 | 2,698 | 10,557 | 3430.77% |
| 10 | Hong Kong | 10,601 | 12,088 | 8,209 | -22.56% |
Global Wigs of Synthetic Materials Export Market Share from 2010 to 2012
| NO. | Country/Region | Export Value Percentage | ||
| 2010 | 2011 | 2012 | ||
| 1 | China | 54.61% | 50.85% | 54.45% |
| 2 | Indonesia | 13.05% | 15.66% | 14.28% |
| 3 | Republic of Korea | 7.05% | 6.79% | 5.53% |
| 4 | Togo | 2.38% | 3.06% | 3.20% |
| 5 | Vietnam | 0.65% | 0.81% | 2.97% |
| 6 | Canada | 4.89% | 4.50% | 2.88% |
| 7 | USA | 3.21% | 2.39% | 2.63% |
| 8 | Senegal | 0.93% | 0.70% | 1.85% |
| 9 | Bangladesh | 0.08% | 0.68% | 1.85% |
| 10 | Hong Kong | 2.98% | 3.06% | 1.44% |
The total export value of global wigs of synthetic materials reached to 356 million US dollars, 395 million US dollars and 572 million US dollars respectively from 2010 to 2012. The export value of 2012 increased with a quick growth by 60.66% compared to 2010.
Wigs of synthetic materials' main exporting countries are China, Indonesia and South Korea and the export value of the three countries/regions accounted for 74.26% of the global total export value. Among the top ten exporting markets from 2010 to 2012, the export value of Vietnam, Senegal and Bangladesh increased with a quick growth by 629.97%, 219.69% and 3430.77% separately.
China is the world's most important exporter of wigs of synthetic materials, global more than 50% wigs of synthetic materials are imported from China and the industry exporting source areas are highly concentrated. China's export value of wigs of synthetic materials in 2012 increased by 60.16% compared to 2010 (the increase is slightly lower than the global wig export value growth), which amounted to 311 million US dollars, accounting for 54.45% of global total export value of 2012.
Global Wigs of Human Hair Export Analysis from 2010 to 2012
Global Wigs of Human Hair Export Market from 2010 to 2012
| NO. | Country/Region | Export Value (Thousand USD) | Growth Compared 2012 to 2010 | ||
| 2010 | 2011 | 2012 | |||
|
| Global | 1,026,557 | 1,180,107 | 1,376,135 | 34.05% |
| 1 | China | 879,732 | 1,000,077 | 1,185,486 | 34.76% |
| 2 | Indonesia | 35,486 | 42,149 | 49,247 | 38.78% |
| 3 | Hong Kong | 41,076 | 42,123 | 46,266 | 12.64% |
| 4 | USA | 17,742 | 22,456 | 23,704 | 33.60% |
| 5 | Italy | 12,533 | 14,119 | 13,017 | 3.86% |
| 6 | Germany | 9,870 | 11,729 | 12,362 | 25.25% |
| 7 | Republic of Korea | 4,955 | 7,197 | 5,923 | 19.54% |
| 8 | UK | 3,401 | 6,654 | 5,384 | 58.31% |
| 9 | Netherlands | 3,015 | 3,556 | 4,243 | 40.73% |
| 10 | France | 2,956 | 3,176 | 3,967 | 34.20% |
Global Wigs of Human Hair Export Market Share from 2010 to 2012
| NO. | Country/Region | Export Value Percentage | ||
| 2010 | 2011 | 2012 | ||
| 1 | China | 85.70% | 84.74% | 86.15% |
| 2 | Indonesia | 3.46% | 3.57% | 3.58% |
| 3 | Hong Kong | 4.00% | 3.57% | 3.36% |
| 4 | USA | 1.73% | 1.90% | 1.72% |
| 5 | Italy | 1.22% | 1.20% | 0.95% |
| 6 | Germany | 0.96% | 0.99% | 0.90% |
| 7 | Republic of Korea | 0.48% | 0.61% | 0.43% |
| 8 | UK | 0.33% | 0.56% | 0.39% |
| 9 | Netherlands | 0.29% | 0.30% | 0.31% |
| 10 | France | 0.29% | 0.27% | 0.29% |
The total export value of global wigs of human hair reached to 1.027 billion US dollars, 1.18 billion US dollars and 1.376 billion US dollars respectively from 2010 to 2012. The export value of 2012 increased with a quick growth by 34.05% compared to 2010.
Wigs of human hair's main exporting countries are China, Indonesia and Hong Kong and the export value of the three countries/regions accounted for 93.09% of the global total export value.
China is the world's most important exporter of wigs of human hair. China's export value of wigs of human hair in 2012 increased by 34.76% compared to 2010, which amounted to 1.185 billion US dollars, accounting for 86.15% of global total export value of 2012. The industry exporting source areas are highly concentrated.
Global Wigs of Other Materials Export Analysis from 2010 to 2012
Global Wigs of Other Materials Export Market from 2010 to 2012
Global Wigs of Other Materials Export Market from 2010 to 2012
| NO. | Country/Region | Export Value (Thousand USD) | Growth Compared 2012 to 2010 | ||
| 2010 | 2011 | 2012 | |||
|
| Global | 707,124 | 1,006,599 | 1,123,493 | 58.88% |
| 1 | China | 635,736 | 905,088 | 1,023,321 | 60.97% |
| 2 | Indonesia | 28,621 | 42,072 | 48,321 | 68.83% |
| 3 | Thailand | 12,945 | 12,165 | 12,057 | -6.86% |
| 4 | Republic of Korea | 6,903 | 13,556 | 8,177 | 18.46% |
| 5 | USA | 5,284 | 7,104 | 7,476 | 41.48% |
| 6 | Mozambique | 4,199 | 9,061 | 5,423 | 29.15% |
| 7 | Hong Kong | 2,173 | 2,357 | 4,064 | 87.02% |
| 8 | Italy | 822 | 1,880 | 1,984 | 141.36% |
| 9 | Denmark | 11 | 60 | 1,457 | 13145.45% |
| 10 | Taiwan | 1,047 | 974 | 1,252 | 19.58% |
Global Wigs of Other Materials Export Market Share from 2010 to 2012
| NO. | Country/Region | Export Value Percentage | ||
|
|
| 2010 | 2011 | 2012 |
| 1 | China | 89.90% | 89.92% | 91.08% |
| 2 | Indonesia | 4.05% | 4.18% | 4.30% |
| 3 | Thailand | 1.83% | 1.21% | 1.07% |
| 4 | Republic of Korea | 0.98% | 1.35% | 0.73% |
| 5 | USA | 0.75% | 0.71% | 0.67% |
| 6 | Mozambique | 0.59% | 0.90% | 0.48% |
| 7 | Hong Kong | 0.31% | 0.23% | 0.36% |
| 8 | Italy | 0.12% | 0.19% | 0.18% |
| 9 | Denmark | 0.00% | 0.01% | 0.13% |
| 10 | Taiwan | 0.15% | 0.10% | 0.11% |
The total export value of global wigs of other materials reached to 707 million US dollars, 1007 million US dollars and 1123 million US dollars respectively from 2010 to 2012. The export value of 2012 increased by 58.88% compared to 2010.
Wigs of other materials' main exporting countries are China, Indonesia and Thailand and the export value of the three countries/regions accounted for 96.45% of the global total export value. Among the top ten exporting markets from 2010 to 2012, the export value of Denmark and Italy increased with a quick growth by 13145.45% and 141.36% separately.
China is the world's most important exporter of wigs of other materials, global more than 90% wigs of other materials are imported from China and the industry exporting source areas are highly concentrated. China's export value of wigs of other materials in 2012 increased by 60.97% compared to 2010, which amounted to 1023 million US dollars, accounting for 91.08% of global total export value of 2012.
Source: UN Comtrade


