China Wigs Exports from Jan. to September in 2012
| Month | Volume (kg) | Value (USD) | YOY | |
| Volume | Value | |||
| January | 3,663,286 | 218,786,633 | -5.4% | -0.6% |
| February | 2,614,365 | 167,777,653 | 44.8% | 48.8% |
| March | 2,806,879 | 202,823,652 | -31.7% | -19.2% |
| April | 3,628,523 | 233,369,105 | -7.9% | -3.5% |
| May | 4,310,113 | 258,444,861 | -3.9% | -2.0% |
| June | 4,651,289 | 275,071,289 | 4.8% | 2.4% |
| July | 4,918,788 | 281,375,849 | 18.0% | 27.5% |
| August | 5,011,877 | 284,773,515 | 7.5% | 25.0% |
| September | 4,371,941 | 269,587,139 | -2.7% | 16.7% |
| Jan.-September Total | 35,977,061 | 2,192,009,696 | 0.0% | 7.6% |
From Jan. to September in 2013, our country exported 36,000 ton wigs, which is impartial with the same time of 2012. The export value amounted to is 2.192 billion US dollars, with an increase of 7.6% year on year.
China Wigs Export Countries/Regions Distribution from Jan. to September in 2013
| NO. | Country/Region | Volume (kg) | Value (USD) | YOY | |
| Volume | Value | ||||
| 1 | USA | 12,078,089 | 884,123,626 | -11.8% | -5.8% |
| 2 | Benin | 2,196,186 | 202,100,260 | -19.7% | -4.3% |
| 3 | Nigeria | 2,760,361 | 184,365,514 | 24.7% | 38.4% |
| 4 | South Africa | 2,907,287 | 138,258,196 | 22.4% | 35.3% |
| 5 | Hong Kong | 1,261,381 | 99,950,617 | 22.0% | 50.0% |
| 6 | Japan | 943,720 | 80,703,557 | -9.0% | -0.1% |
| 7 | UK | 987,219 | 76,413,387 | -2.8% | 2.3% |
| 8 | Ghana | 899,325 | 71,373,177 | 4.2% | 28.3% |
| 9 | UAE | 568,972 | 44,524,420 | 49.2% | 336.2% |
| 10 | France | 505,442 | 32,898,946 | -0.6% | 6.8% |
| 11 | Cote d'Ivoire | 452,800 | 27,347,673 | 13.6% | 1.3% |
| 12 | Republic of Korea | 286,949 | 25,631,141 | -35.0% | -11.8% |
| 13 | Germany | 488,052 | 23,535,123 | -14.3% | -27.8% |
| 14 | The Russian Federation | 732,603 | 23,368,040 | -4.5% | 74.3% |
| 15 | Democratic Republic of the Congo | 293,138 | 16,811,954 | 14.9% | -4.9% |
| 16 | Angola | 301,812 | 14,704,064 | 59.9% | 68.0% |
| 17 | Tanzania | 299,724 | 12,715,983 | 25.3% | 75.0% |
| 18 | Belgium | 182,700 | 12,455,147 | 73.7% | 508.8% |
| 19 | Canada | 267,788 | 12,383,145 | -7.3% | -9.1% |
| 20 | Italy | 255,771 | 11,667,622 | 5.1% | -0.1% |
Our wig products were mainly exported to the United States, Benin, Nigeria, South Africa, Hong Kong, Japan, the UK, Ghana, the UAE and France from Jan. to September in 2013.
The United States is China's most important export market for wigs. During the first nine months of 2013, China's export value of wigs to the United States accounted for 40% of China's total export value of wigs.
From Jan. to September in 2013, China's export value of wigs to UAE and Belgium increased by 336.2% and 508.8% respectively.
China Wigs Main Export Source Areas from Jan. to September in 2013
| Region | Volume (kg) | Value (USD) | YOY | |
| Volume | Value | |||
| Henan | 10,820,430 | 1,126,192,632 | -13.8% | -1.7% |
| Shandong | 8,161,802 | 530,349,610 | 9.1% | 9.3% |
| Hunan | 524,351 | 94,876,407 | 20.4% | 23.5% |
| Guangdong | 3,922,026 | 75,404,444 | -0.6% | 33.8% |
| Anhui | 452,826 | 73,894,427 | -0.7% | 9.7% |
| Zhejiang | 7,727,237 | 59,640,740 | 14.4% | 35.4% |
| Jiangxi | 670,572 | 40,394,678 | -19.1% | 29.7% |
| Chongqing | 263,635 | 37,254,770 | 30.0% | 30.3% |
| Xinjiang Uygur Autonomous Region | 280,778 | 32,518,123 | 764.2% | 915.9% |
| Liaoning | 201,470 | 21,857,934 | -14.9% | 26.7% |
| Tianjin | 685,678 | 16,986,622 | -9.2% | -16.1% |
| Jiangsu | 522,419 | 12,838,977 | 75.2% | 99.8% |
| Hebei | 169,399 | 11,955,937 | 19.1% | 15.2% |
| Heilongjiang | 488,497 | 11,214,996 | -12.5% | 208.1% |
| Sichuan | 98,007 | 9,042,828 | -48.5% | 3.4% |
| Fujian | 294,905 | 6,987,218 | -29.4% | -37.9% |
| Hubei | 52,960 | 6,742,314 | 355.3% | 1977.5% |
| Beijing | 31,883 | 5,167,164 | 131.8% | 218.1% |
| Yunnan | 327,458 | 4,493,462 | -13.3% | -42.2% |
| Shanghai | 215,548 | 3,467,403 | -9.6% | -51.1% |
| Inner Mongolia Autonomous Region | 17,195 | 3,002,293 | 0.0% | 0.0% |
| Guizhou | 16,116 | 2,767,951 | -48.9% | -37.7% |
| Gansu | 13,431 | 2,355,743 | 0.0% | 0.0% |
| Shanxi | 15,928 | 1,912,603 | 31756.0% | 813773.6% |
| Tibet | 1,775 | 638,303 | -62.5% | 208.1% |
| Qinghai | 116 | 44,467 | 0.0% | 0.0% |
| Guangxi Zhuang Autonomous Region | 330 | 6,000 | -93.9% | -87.4% |
| Jilin | 150 | 955 | 0.0% | 0.0% |
| Ningxia Hui Autonomous Region | 139 | 695 | 0.0% | 0.0% |
From Jan. to September in 2013, Henan, Shandong, Hunan, Guangdong and Anhui Province are China's major wigs export source areas. Among them, the export value of wig products in Henan accounted for more than 50% of the total export value of our country, while the export value of Shandong accounted for nearly 1/4 of the total export value, and the exporting source areas are highly concentrated.
Henan mainly exported wigs of human hair and other materials while Shandong was the largest export source area of complete wigs of synthetic materials and wigs of synthetic materials of our country.
Wig Industry Export Products Distribution from Jan. to September in 2013
| Product Name | Volume (kg) | Value (USD) | YOY | |
| Volume | Value | |||
| Wigs of Human Hair | 6,607,253 | 1,131,805,363 | 23.0% | 31.8% |
| Wigs of Other Materials | 9,915,128 | 680,277,524 | -21.6% | -17.6% |
| Wigs of Synthetic Materials | 10,413,375 | 247,582,302 | 18.9% | 10.3% |
| Complete Wigs of Synthetic Materials | 9,041,305 | 132,344,507 | -1.6% | 2.6% |
From Jan. to September in 2013, our country exported 6600 ton wigs of human hair, which accounted for 18.37% of the total exports of wigs. The export value reached to 1.132 billion US dollars, which accounted for 51.63% of the total export value. The export volume of wigs of other materials amounted to 9900 ton, which accounted for 27.56% of the total exports. The export value reached to 680 million US dollars, which accounted for 31.03% of the total export value. The export volume of wigs of synthetic materials amounted to 10400 ton and the export value reached to 248 million US dollars, which accounted for 28.94% of the total export volume and 11.29% of the total export value. The export volume of complete wigs of synthetic materials amounted to 9000 ton during the first nine months of 2013 and the export value reached to 132 million US dollars, which accounted for 25.13% of the total export volume and 6.04% of the total export value.
Wig Export Unit Price from Jan. to September in 2013
| Product Name | Unit Price (USD/kg) |
| Wigs of Human Hair | 171.3 |
| Wigs of Other Materials | 68.61 |
| Wigs of Synthetic Materials | 23.78 |
| Complete Wigs of Synthetic Materials | 14.64 |
Among the wig products in 2013, the export unit price of wigs of human hair is the highest, up to 171.3 USD/kg. Followed by wigs of other materials, the export unit price is 68.61 USD/kg. The export unit price of synthetic wig products is lower. The export unit price of wigs of synthetic materials is 23.78 USD/kg and the export unit price of complete wigs of synthetic materials is 14.64 USD/kg.
China Complete Wigs of Synthetic Materials Exports from Jan. to September in 2013
Complete Wigs of Synthetic Materials Main Export Source Areas from Jan. to September in 2013
Shandong,Guangdong,Zhejiang,Henan,Tianjin,others
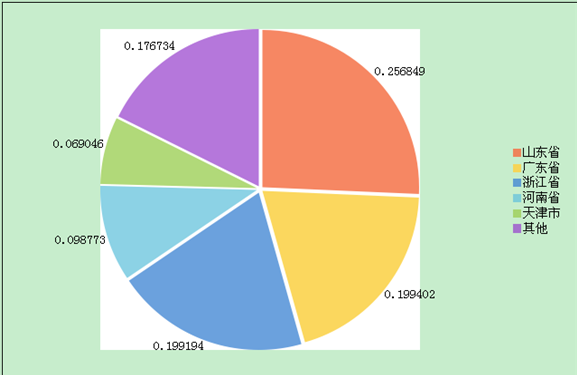
From Jan. to September in 2013, Shandong, Guangdong, Zhejiang, Henan and Tianjin are complete wigs of synthetic materials main export source areas. The export value of the above five provinces and cities accounted for 82.33% of the total export value. China's complete wigs of synthetic materials mainly exported to the United States, Hong Kong, Nigeria, Japan, South Africa, Britain, Russia, Germany, Angola and France.
Complete Wigs of Synthetic Materials Main Export Source Areas Unit Price from Jan. to September in 2013
Nationwide,Shandong,Guangdong,Zhejiang,Henan,Tianjin
Unit:USD/kg
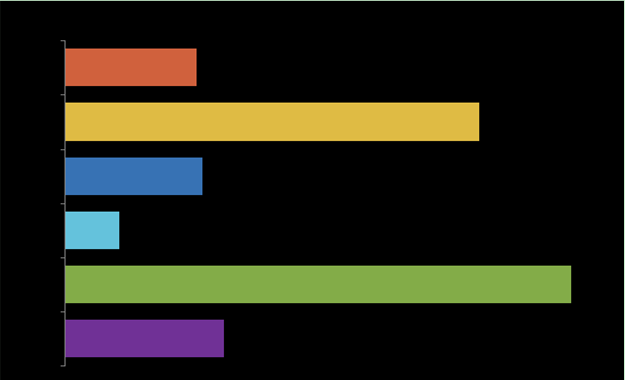
The average export unit price of the first nine months of 2013 of complete wigs of synthetic materials is 14.64 USD/kg. And the average export unit price of Shandong, Guangdong, Zhejiang, Henan and Tianjin is 45.82 USD/kg, 15.27 USD/kg, 6.10 USD/kg, 56.00 USD/kg and 17.59 USD/kg separately. The average export unit price of Guangdong and Tianjin is close to the industry export unit price, and the export unit price of Shandong and Henan is respectively 3.1 and 3.8 times of the industry export unit price. From the analysis of export average unit price, Shandong and Henan mainly export high-grade complete wigs of synthetic materials. Guangdong and Tianjin mainly export middle-grade complete wigs of synthetic materials, while cheap complete wigs of synthetic materials are mainly from Zhejiang.
Among the cities, the highest export value of complete wigs of synthetic materials is in Yiwu, Zhejiang. 81.2% of Zhejiang complete wigs of synthetic materials are from Yiwu, with an average export unit price of 5.78 USD/kg. About 40% of Shandong complete wigs of synthetic materials are from Qingdao, with an average export unit price of 47.50 USD/kg. 41.1% of Guangdong complete wigs of synthetic materials are from Shenzhen, with an average export unit price of 20.77 USD/kg. And 75% of Henan complete wigs of synthetic materials are from Xuchang, with an average export unit price of 61.69 USD/kg.
China Wigs of Synthetic Materials Exports from Jan. to September in 2013
Wigs of Synthetic Materials Main Export Source Areas from Jan. to September in 2013
Shandong,Henan, Guangdong, Zhejiang, Liaoning, others
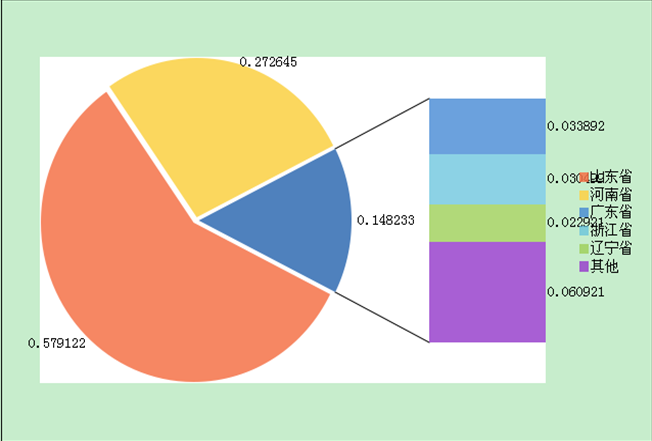
From Jan. to September in 2013, Shandong, Henan, Guangdong, Zhejiang and Liaoning are wigs of synthetic materials main export source areas, among of which, the export value of Shandong and Henan accounted for 57.91% and 27.26% of the total export value separately. The export value of the above five provinces accounted for 93.91% of the total export value. China's wigs of synthetic materials mainly exported to the United States, Nigeria, South Africa, Japan, Hong Kong, Ghana, Benin, the United Kingdom, France and South Korea.
Wigs of Synthetic Materials Main Export Source Areas Unit Price from Jan. to September in 2013
Nationwide, Shandong, Henan, Guangdong, Zhejiang, Liaoning
Unit:USD/kg
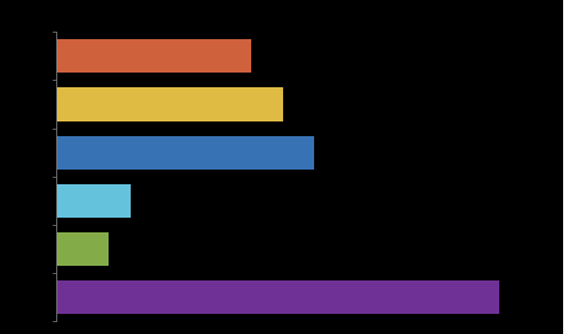
The average export unit price of the first nine months of 2013 of wigs of synthetic materials is 23.78 USD/kg. And the average export unit price of Shandong, Henan, Guangdong, Zhejiang and Liaoning is 27.69 USD/kg, 31.46 USD/kg, 9.08 USD/kg, 6.40 USD/kg and 54.01 USD/kg separately. From the analysis of export average unit price, Liaoning mainly exports high-grade wigs of synthetic materials. Shandong and Henan mainly export middle-grade wigs of synthetic materials, while cheap complete wigs of synthetic materials are mainly from Guangdong and Zhejiang.
Among the cities, the highest export value of wigs of synthetic materials is in Xuchang, Henan, and the other four, Qingdao, Jiaozhou, Heze and Weifang all belong to Shandong province. In the above five districts except for Heze in Shandong, the average export unit price of which is about twice the nation average export unit price, the other four districts' average export unit price is close to the nation average export unit price.
China Wigs of Human Hair Exports from Jan. to September in 2013
Wigs of Human Hair Main Export Source Areas from Jan. to September in 2013
Henan,Shandong, Hunan, Anhui, Chongqing, others
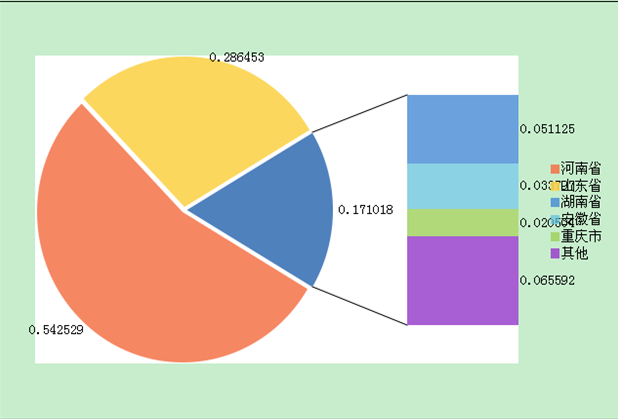
From Jan. to September in 2013, Henan, Shandong, Hunan, Anhui and Chongqing are wigs of human hair main export source areas, among of which, the export value of Henan and Shandong accounted for 54.25% and 28.65% of the total export value separately. The export value of the above five provinces accounted for 93.44% of the total export value. China's wigs of human hair mainly exported to the United States, Nigeria, the United Kingdom, Benin, Japan, Hong Kong, the UAE, and South Africa, Ghana and France.
Wigs of Human Hair Main Export Source Areas Unit Price from Jan. to September in 2013
Nationwide, Henan, Shandong, Hunan, Anhui, Chongqing
Unit:USD/kg
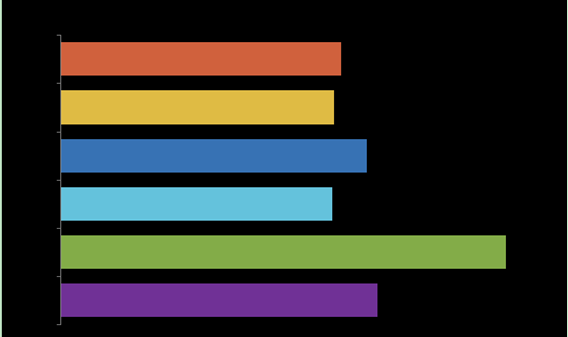
The average export unit price of the first nine months of 2013 of wigs of human hair is 171.3 USD/kg. And the average export unit price of Henan, Shandong, Hunan, Anhui and Chongqing is 166.76 USD/kg, 186.85 USD/kg, 166.13 USD/kg, 272.05 USD/kg and 193.32 USD/kg separately.
Among the cities, among the five districts of the highest export value of wigs of human hair, Shandong monopolizes 3 seats, and the highest export value in Xuchang, Henan. Qingdao, Jiaoze and Jiaozhou in Shandong ranked from the second to the fourth successively, and Shaoyang in Hunan ranked the fifth.
China Wigs of Other Materials Exports from Jan. to September in 2013
Wigs of Other Materials Main Export Source Areas from Jan. to September in 2013
Henan, Hunan, Anhui, Shandong, Xinjiang Uygur Autonomous Region, others
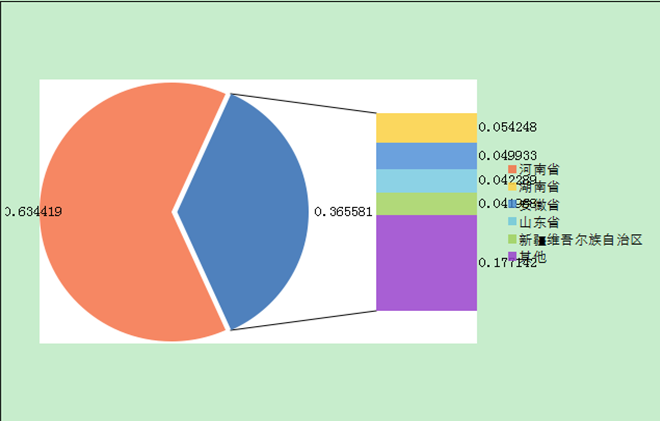
From Jan. to September in 2013, Henan, Hunan, Anhui, Shandong and Xinjiang Uygur Autonomous Region are wigs of other materials main export source areas, among of which, the export value of Henan accounted for 63.44% of the total export value. The export value of the above five provinces accounted for 82.29% of the total export value. China's wigs of other materials mainly exported to the United States, Benin, South Africa, Nigeria, Hong Kong, Ghana, Cote d'Ivoire, Japan, South Korea and the United Arab Emirates.
Wigs of Other Materials Main Export Source Areas Unit Price from Jan. to September in 2013
Nationwide, Henan, Hunan, Anhui, Shandong, Xinjiang Uygur Autonomous Region
Unit:USD/kg
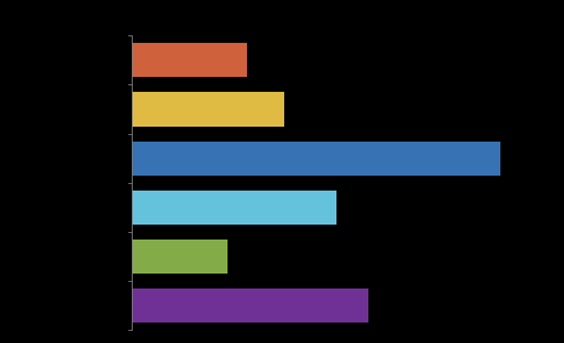
The average export unit price of the first nine months of 2013 of wigs of other materials is 68.61 USD/kg. And the average export unit price of Henan, Hunan, Anhui, Shandong and Xinjiang Uygur Autonomous Region is 90.68 USD/kg, 220.02 USD/kg, 122.35 USD/kg, 56.82 USD/kg and 141.27 USD/kg separately.
Among the cities, among the five districts of the highest export value of wigs of other materials, Henan monopolizes 3 seats. Xuchang, Luohe and Zhoukou in Henan ranked the first, the second and the fourth successively, and Shaoyang in Hunan ranked the third, Fuyang in Anhui ranked the fifth.
Source: Customs Information Network


