Customs data show that in 2012 Chinese wire and cable export volume amounted to 1,936,500 tons, with an increase of 3.4%; export value amounted to 17.425 billion U.S. dollars, with an increase of 12.5%.
Seen from sub-categories of the products, export value of electrical conductors with connectors rated voltage less than 1000V amounted to 7.226 billion U.S. dollars, accounting for 41.5% of Chinese wire and cable total export value over the same period. Export value of Ignition wiring sets for motor vehicles and other wiring sets reached 3.142 billion U.S. dollars, accounting for 18%; export value of coaxial cable and other coaxial electric conductors amounted to 1.446 billion U.S. dollars, accounting for 8.3%.
Judging from export value growth, export Value of which grew more than 20% are other vehicles, aircraft, marine ignition wiring sets and other wiring sets; cables, 35kV <rated voltage ≤ 110kV; cable each composited of coated optical fiber; other electric conductors with connectors, rated voltage ≤ 80V; other electric conductors, rated voltage ≤ 80V; cable, 1kV <rated voltage ≤ 35kV, with an increase of export value were separately 47.3%, 41.3%, 37.4%, 26.3%, 21.5%, 20.1 %.
Products of which export value substantial decline are cable, 110kV <rated voltage ≤ 220kV; cables, rated voltage> 220kV, with a decrease by 48.8%, 71.9%
2010-2012 Chinese Wire and Cable Export Volume and Growth Rate
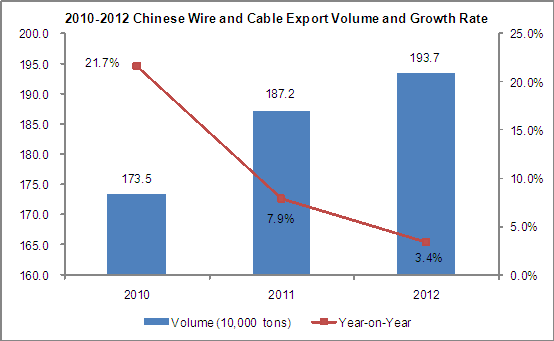
2010-2012 China wire and cable export volume increased year by year, but the increase gradually narrowed, in 2012 export volume amounted to
1.937 million tons, with an increase of 3.4%, which decreased by 4.5 percentage points compared to 2011 increase.
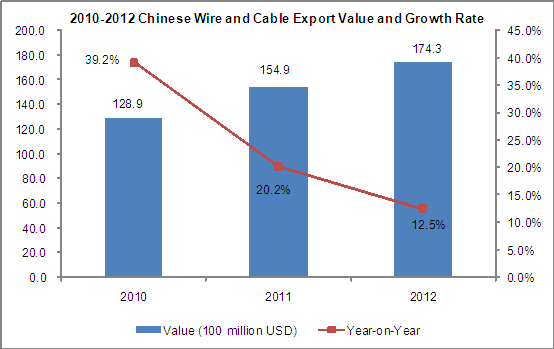
2010-2012 Chinese Wire and Cable Export Value and Growth Rate
Consistent with export volume trend, 2010-2012 Chinese wire and cable export value increased year by year, the increase gradually narrowed, export value of 2012 amounted to $ 17.43 billion, with an increase of 12.5%, which decreased by 7.7 percentage points compared to 2011 increase.
2010-2012 Chinese Wire and Cable Monthly Export Volume (Unit : 10,000 tons)
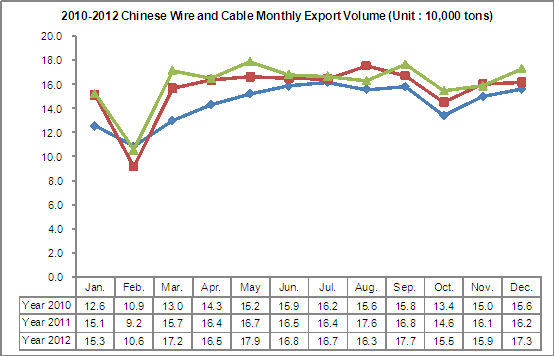
From the monthly export volume trend can be seen February was export off season, while in March export volume increased rapidly and maintained at a high level, and in October dropped slightly. The monthly export volume in 2011 increased significantly, while the export volume for each month of 2012 is basically maintaining 2011 levels.
2010-2012 Chinese Wire and Cable Monthly Export Value (Unit: 100 million USD)
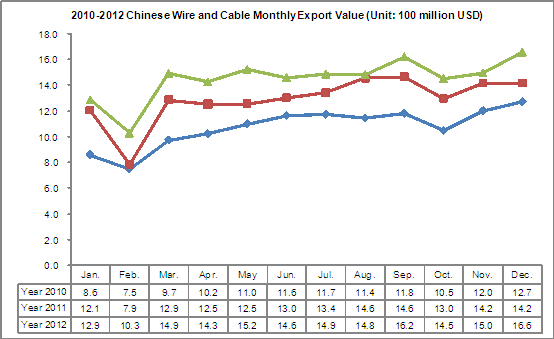
Consistent with export volume monthly trend, the annual lowest export value was in February, while in March export value increased rapidly and maintained at a high level, and in October dropped slightly. Export value of each month in 2012 increased year on year, which was different from export volume.
2010-2012 Chinese Wire and Cable Export Market Trend
| No. | Country/Region | China's Export Value to Main Country/Region (Unit: 100 million USD) | Export Value Increase 2012 compared with 2010 | ||
| 2010 | 2011 | 2012 | |||
| 1 | ↑Hong Kong | 19.28 | 22.96 | 28.41 | 47.35% |
| 2 | ↑USA | 20.67 | 22.97 | 27.38 | 32.47% |
| 3 | ↑Japan | 21.19 | 23.36 | 26.52 | 25.15% |
| 4 | ↑South Korea | 9.98 | 13.60 | 14.07 | 41.02% |
| 5 | ↑Australia | 3.40 | 4.82 | 4.90 | 43.87% |
| 6 | ↑Singapore | 2.56 | 3.02 | 4.06 | 58.88% |
| 7 | Germany | 3.13 | 3.65 | 3.58 | 14.35% |
| 8 | India | 3.66 | 4.21 | 3.50 | -4.39% |
| 9 | ↑Thailand | 1.81 | 2.77 | 3.32 | 83.35% |
| 10 | ↑UK | 2.79 | 3.06 | 3.19 | 14.29% |
| No. | Country/Region | Market Share | ||
| 2010 | 2011 | 2012 | ||
| 1 | Hong Kong | 14.96% | 14.83% | 16.30% |
| 2 | USA | 16.03% | 14.83% | 15.71% |
| 3 | Japan | 16.44% | 15.08% | 15.22% |
| 4 | South Korea | 7.74% | 8.78% | 8.08% |
| 5 | Australia | 2.64% | 3.12% | 2.81% |
| 6 | Singapore | 1.98% | 1.95% | 2.33% |
| 7 | Germany | 2.43% | 2.36% | 2.05% |
| 8 | ↓India | 2.84% | 2.72% | 2.01% |
| 9 | ↑Thailand | 1.40% | 1.79% | 1.90% |
| 10 | ↓UK | 2.17% | 1.97% | 1.83% |
Note: “↑”represents the indicators listed continued to rise from 2010 to 2012, “↓”represents the indicators listed continued to decline from 2010 to 2012.
Hong Kong, the United States and Japan are Chinese wire and cable three major export markets, accounting for total exports of wire and cable 16.30%, 15.71% and 15.22% in 2012. 2012 compared to 2010 increased by 47.35%, 32.47%, 25.15%.
Judging from the growth in export value, except for Germany and India, China export value to the top ten wire and cable export markets have maintained continuous growth. Among them, the export value of Thailand increased the fastest, with an increase of 83.35% compared 2012 to 2010, followed by Singapore, with an increase of 58.88%.
Seen from changes of market share, market share of Thailand accounting for Chinese wire and cable export value increased year by year, while India and the United Kingdom decreased year by year. In addition, Hong Kong market share growth trend is more obvious, while Japanese market share decline significantly.
2010-2012 Chinese Wire and Cable Export Source Area Trend
| No. | Country/Region | Export Value (Unit: 100 million USD) | Export Value Increase 2012 compared with 2010 | ||
| 2010 | 2011 | 2012 | |||
| 1 | ↑Guangdong | 49.32 | 57.19 | 67.90 | 37.67% |
| 2 | ↑Zhejiang | 20.06 | 24.71 | 26.45 | 31.84% |
| 3 | ↑Jiangsu | 20.10 | 23.79 | 25.56 | 27.16% |
| 4 | ↑Shandong | 12.27 | 15.36 | 16.84 | 37.17% |
| 5 | ↑Shanghai | 7.83 | 9.36 | 10.07 | 28.67% |
| 6 | ↑Fujian | 4.63 | 5.74 | 6.15 | 32.72% |
| 7 | ↑Tianjin | 2.43 | 3.12 | 3.16 | 30.37% |
| 8 | ↑Liaoning | 2.22 | 2.59 | 2.78 | 25.22% |
| 9 | ↑Beijing | 1.69 | 2.17 | 2.21 | 30.63% |
| 10 | ↑Hebei | 0.99 | 1.49 | 2.09 | 111.96% |
| No. | Country/Region | Market Share | ||
| 2010 | 2011 | 2012 | ||
| 1 | Guangdong | 38.26% | 36.93% | 38.97% |
| 2 | Zhejiang | 15.56% | 15.95% | 15.18% |
| 3 | ↓Jiangsu | 15.59% | 15.36% | 14.67% |
| 4 | Shandong | 9.52% | 9.92% | 9.66% |
| 5 | ↓Shanghai | 6.07% | 6.04% | 5.78% |
| 6 | Fujian | 3.59% | 3.71% | 3.53% |
| 7 | Tianjin | 1.88% | 2.02% | 1.82% |
| 8 | ↓Liaoning | 1.72% | 1.67% | 1.60% |
| 9 | Beijing | 1.31% | 1.40% | 1.27% |
| 10 | ↑Hebei | 0.76% | 0.96% | 1.20% |
Note: “↑”represents the indicators listed continued to rise from 2010 to 2012, “↓”represents the indicators listed continued to decline from 2010 to 2012.
Guangdong Province is our country's largest wire and cable export province, the export value of which accounting for nearly 40 percent of total export value of Chinese wire and cable in 2012. Zhejiang, Jiangsu, Shandong and Shanghai were ranked second to fifth place separately.
Judging from the growth of export value, the top ten export source areas export value remained sustainable growth from 2010 to 2012. Hebei Province increased the fastest, with an increase by 111.96% compared 2012 to 2010.
Seen from changes of market share, market share of Jiangsu, Shanghai, Liaoning continued declining, among which Jiangsu Province declined more obviously. Market share of Hebei increased year by year.
2012 Chinese Wire and Cable Export Volume and Value
| Month | Volume (10,000 tons) | Value (100 million USD) | Volume Year on Year | Value Year on Year |
| January | 15.3 | 12.9 | 0.7% | 6.5% |
| February | 10.6 | 10.3 | 15.2% | 30.9% |
| March | 17.2 | 14.9 | 9.5% | 16.0% |
| April | 16.5 | 14.3 | 0.9% | 14.0% |
| May | 17.9 | 15.2 | 7.5% | 21.5% |
| June | 16.8 | 14.6 | 1.7% | 12.1% |
| July | 16.7 | 14.9 | 1.5% | 10.8% |
| August | 16.3 | 14.8 | -7.1% | 1.9% |
| September | 17.7 | 16.2 | 5.4% | 10.8% |
| October | 15.5 | 14.5 | 6.4% | 12.1% |
| November | 15.9 | 15.0 | -1.2% | 5.6% |
| December | 17.3 | 16.6 | 6.9% | 17.1% |
| Jan.-Dec. Total | 194 | 174.3 | 3.4% | 12.5% |
2012 Chinese wire and cable export volume amounted to 1.94 million tons, with an increase of 3.4%; export value totally amounted to $ 17.43 billion, with an increase of 12.5%. Throughout the year, ten months' export volume increased year on year.
2012 Chinese Wire and Cable Main Export Countries/Regions Distribution (By Export Value)
| No. | Country/Region | Jan.-Dec. Total | Total Year on Year | ||
| Volume (10,000 tons) | Value (100 million USD) | Volume | Value | ||
| 1 | Hong Kong | 20.19 | 28.41 | -16.6% | 23.7% |
| 2 | USA | 31.51 | 27.38 | 15.2% | 19.2% |
| 3 | Japan | 12.08 | 26.52 | 6.1% | 13.5% |
| 4 | South Korea | 12.79 | 14.07 | -6.3% | 3.5% |
| 5 | Australia | 7.67 | 4.90 | 9.1% | 1.5% |
| 6 | Singapore | 5.00 | 4.06 | 26.5% | 34.7% |
| 7 | Germany | 4.75 | 3.58 | -2.5% | -2.0% |
| 8 | India | 5.83 | 3.50 | -12.5% | -16.9% |
| 9 | Thailand | 5.25 | 3.32 | 18.2% | 19.9% |
| 10 | UK | 4.70 | 3.19 | -4.0% | 4.5% |
| 11 | Indonesia | 5.01 | 3.14 | 16.2% | 8.6% |
| 12 | Canada | 2.53 | 3.13 | 7.6% | 19.0% |
| 13 | Vietnam | 2.96 | 3.07 | 1.6% | 27.6% |
| 14 | Malaysia | 3.38 | 2.90 | 39.7% | 64.5% |
| 15 | Taiwan | 1.85 | 2.31 | -15.1% | -16.6% |
| 16 | Philippines | 3.22 | 2.06 | 26.4% | 25.1% |
| 17 | Netherlands | 2.41 | 2.04 | 0.6% | 5.7% |
| 18 | UAE | 4.29 | 1.95 | 5.2% | 5.7% |
| 19 | The Russian Federation | 3.54 | 1.94 | -4.4% | -1.0% |
| 20 | Brazil | 2.90 | 1.87 | -6.1% | 10.1% |
2012 Chinese Wire and Cable Main Export Countries/Regions Distribution
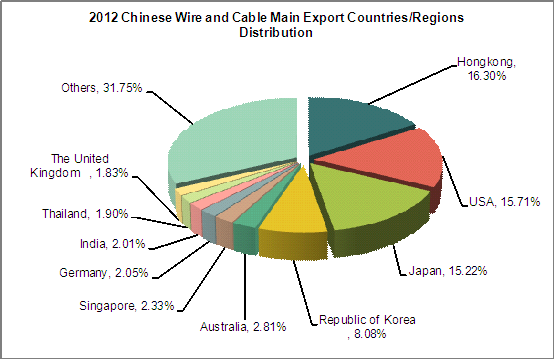
In 2012, Hong Kong, the United States, Japan, Korea and Australia are Chinese wire and cable's top five export markets, accounted for 16.3%, 15.71%, 15.22%, 8.08% and 2.81%.
Among Top twenty largest export destination markets, the export volume to the twelve countries/regions increased year on year, while the other eight decreased. Seen from export volume year on year, the largest increase was in Malaysia (an increase of 39.7%), followed by Singapore (an increase of 26.5%), the Philippines (an increase of 26.4%).the largest decline was in Hong Kong, with a decrease of 16.6%
2012 Chinese Wire and Cable (HS: 8544) Main Export Source Area Distribution
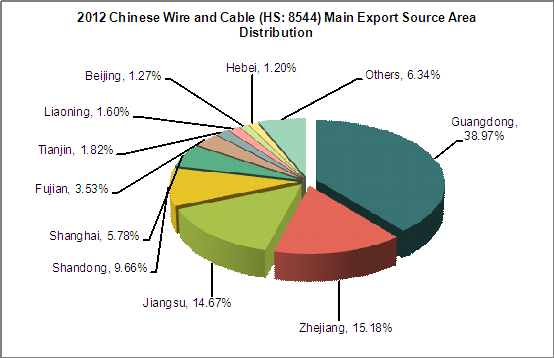
Chinese wire and cable export source area is very concentrated. The top five source areas are Guangdong, Zhejiang, Jiangsu, Shandong and Shanghai. The total export value accounted for 84.25 percent of total export value over the same period.


