2010-2012 India Tubes, Pipes and Hollow Profiles, Seamless, of Iron or Steel Import Value Trend
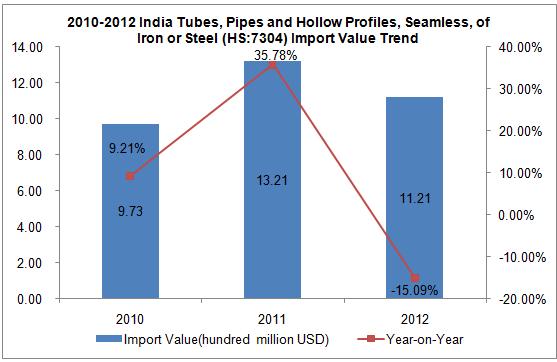
The India's Tubes, Pipes and Hollow Profiles, Seamless, of Iron or Steel import value featured an inverted V from 2010 to 2012. The import value of 2012 amounted to 11.21billion US dollars, increased by 15.09% year on year.
2010-2012 India Tubes, Pipes and Hollow Profiles, Seamless, of Iron or Steel Import Market Analysis
| No. | Import Countries/Regions | Import Value(Thousand USD) | 2012 Import Value Growth compared to 2010 | ||
| 2010 | 2011 | 2012 | |||
| 1 | China | 529,873 | 693,106 | 619,754 | 16.96% |
| 2 | Germany | 36,175 | 50,371 | 92,270 | 155.07% |
| 3 | Japan | 109,624 | 177,138 | 87,390 | -20.28% |
| 4 | Republic of Korea | 25,175 | 20,899 | 51,308 | 103.81% |
| 5 | Italy | 82,809 | 73,271 | 44,598 | -46.14% |
| 6 | France | 36,821 | 42,343 | 43,118 | 17.10% |
| 7 | USA | 30,583 | 50,245 | 38,364 | 25.44% |
| 8 | Spain | 24,898 | 24,619 | 25,231 | 1.34% |
| 9 | United Kingdom | 6,473 | 16,509 | 20,311 | 213.78% |
| 10 | Russian Federation | 7,594 | 24,178 | 18,713 | 146.42% |
| 11 | Sweden | 6,105 | 5,941 | 11,814 | 93.51% |
| 12 | United Arab Emirates | 10,412 | 9,157 | 9,366 | -10.05% |
| 13 | Singapore | 7,706 | 27,793 | 5,940 | -22.92% |
| 14 | Malaysia | 7,938 | 9,163 | 5,523 | -30.42% |
| 15 | Indonesia | 2,320 | 3,415 | 4,488 | 93.45% |
| 16 | Czech Republic | 8,148 | 6,558 | 4,429 | -45.64% |
| 17 | Thailand | 396 | 5,022 | 4,194 | 959.09% |
| 18 | Romania | 7,634 | 14,427 | 4,114 | -46.11% |
| 19 | Belgium | 7,388 | 13,550 | 3,707 | -49.82% |
| 20 | Netherlands | 606 | 1,368 | 2,914 | 380.86% |
From 2010 to 2012, China, Germany and Japan were the top three largest import markets, for the India in Tubes, Pipes and Hollow Profiles, Seamless, of Iron or Steel. Among the India top twenty Tubes, Pipes and Hollow Profiles, Seamless, of Iron or Steel import markets in 2012, the import value from Germany, Republic of Korea, United Kingdom, Russian Federation, Thailand and Netherlands for Tubes, Pipes and Hollow Profiles, Seamless, of Iron or Steel increased by 155.07%, 103.81%, 213.78%, 146.42%, 959.09% and 380.86% compared to that of 2010, increased quickly, which had increased more than 100%.
2010-2012 India Tubes, Pipes and Hollow Profiles, Seamless, of Iron or Steel Import Market Share Analysis
| No. | Import Countries/Regions | Import Value Percentage | ||
| 2010 | 2011 | 2012 | ||
| 1 | China | 54.48% | 52.48% | 55.27% |
| 2 | Germany↑ | 3.72% | 3.81% | 8.23% |
| 3 | Japan | 11.27% | 13.41% | 7.79% |
| 4 | Republic of Korea | 2.59% | 1.58% | 4.58% |
| 5 | Italy↓ | 8.51% | 5.55% | 3.98% |
| 6 | France | 3.79% | 3.21% | 3.84% |
| 7 | USA | 3.14% | 3.80% | 3.42% |
| 8 | Spain | 2.56% | 1.86% | 2.25% |
| 9 | United Kingdom↑ | 0.67% | 1.25% | 1.81% |
| 10 | Russian Federation | 0.78% | 1.83% | 1.67% |
| 11 | Sweden | 0.63% | 0.45% | 1.05% |
| 12 | United Arab Emirates | 1.07% | 0.69% | 0.84% |
| 13 | Singapore | 0.79% | 2.10% | 0.53% |
| 14 | Malaysia↓ | 0.82% | 0.69% | 0.49% |
| 15 | Indonesia↑ | 0.24% | 0.26% | 0.40% |
| 16 | Czech Republic↓ | 0.84% | 0.50% | 0.39% |
| 17 | Thailand | 0.04% | 0.38% | 0.37% |
| 18 | Romania | 0.78% | 1.09% | 0.37% |
| 19 | Belgium | 0.76% | 1.03% | 0.33% |
| 20 | Netherlands↑ | 0.06% | 0.10% | 0.26% |
Note: "↑" represents that the indicators listed continued to increase from 2010 to 2012 "↓"represents that the indicators listed continued to decrease from 2010 to 2012.
Judging from the three year market share, the proportion of import value for Germany, United Kingdom, Indonesia and Netherlands continued to rise, while only that of Italy, Malaysia and Czech Republic continued to decline.
India Tubes, Pipes and Hollow Profiles, Seamless, of Iron or Steel Import from Jan. to Nov. 2013
| Countries/Regions | Total Imports (Thousand USD) from Jan. to Dec. 2013 | Year-on-Year | Percentage |
| Total | 780,692.00 | -25.28% | 100.00% |
| China | 417,907.00 | -26.84% | 53.53% |
| Japan | 82,545.00 | 1.30% | 10.57% |
| Germany | 64,176.00 | -27.20% | 8.22% |
| France | 46,681.00 | 15.67% | 5.98% |
| Italy | 44,568.00 | 15.70% | 5.71% |
| USA | 27,191.00 | -28.52% | 3.48% |
| Spain | 19,837.00 | -18.82% | 2.54% |
| Republic of Korea | 13,132.00 | -73.55% | 1.68% |
| Belgium | 8,566.00 | 163.08% | 1.10% |
| Czech Republic | 6,702.00 | 54.50% | 0.86% |
Among the import Countries/Regions of India Tubes, Pipes and Hollow Profiles, Seamless, of Iron or Steel, China and Japan were the major Original country of imported goods, the import value amounted to 53.53% and 10.57% respectively of the total import value.


