2011-2013 China Toy (HS: 9503) Export Trend Analysis
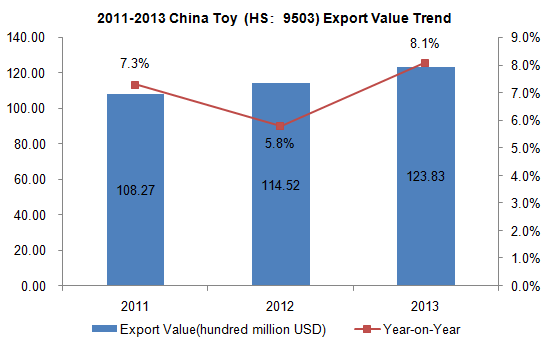
2011-2013 China Toy Export Value Trend

As can be seen from the above chart, China toys export value increased year-on-year (YOY) from 2011 to 2013. The export value for 2013 amounted to 12.383 billion US dollars, an increase of 8.1% compared with the same period in 2012.
2011-2013 China Toy Export Markets Analysis
| No. | Countries/Regions | Export Value (USD) | Export Value Growth Compared 2013 with 2011 | ||
|
|
| 2011 | 2012 | 2013 |
|
| 1 | USA | 3,846,713,657 | 4,035,010,123 | 4,314,705,334 | 12.17% |
| 2 | Hong Kong | 820,597,188 | 806,729,887 | 891,164,820 | 8.60% |
| 3 | United Kingdom | 646,004,516 | 691,751,459 | 726,292,008 | 12.43% |
| 4 | Japan | 490,432,939 | 525,324,878 | 558,127,166 | 13.80% |
| 5 | Germany | 478,512,342 | 456,300,191 | 477,551,783 | -0.20% |
| 6 | Philippines | 441,727,953 | 388,404,340 | 452,942,513 | 2.54% |
| 7 | Singapore | 98,753,848 | 260,310,048 | 327,879,484 | 232.02% |
| 8 | Russian Federation | 208,098,459 | 260,823,331 | 314,725,838 | 51.24% |
| 9 | Canada | 255,769,612 | 261,241,485 | 286,075,885 | 11.85% |
| 10 | France | 312,700,827 | 308,065,925 | 284,391,448 | -9.05% |
| 11 | Mexico | 236,778,041 | 246,013,860 | 284,187,964 | 20.02% |
| 12 | Australia | 228,210,343 | 263,509,814 | 283,965,975 | 24.43% |
| 13 | Netherlands | 241,028,403 | 226,939,918 | 244,729,239 | 1.54% |
| 14 | Republic of Korea | 132,082,425 | 174,086,721 | 202,897,185 | 53.61% |
| 15 | Belgium | 141,347,870 | 136,530,651 | 191,620,861 | 35.57% |
| 16 | Italy | 237,054,416 | 198,570,974 | 183,687,252 | -22.51% |
| 17 | Spain | 193,317,669 | 172,565,107 | 176,430,433 | -8.74% |
| 18 | Brazil | 142,330,493 | 155,016,513 | 169,771,196 | 19.28% |
| 19 | Chile | 125,907,427 | 137,833,522 | 148,510,810 | 17.95% |
| 20 | United Arab Emirates | 145,642,177 | 172,002,707 | 146,457,951 | 0.56% |
The three largest export markets of Chinese toys are the USA, Hong Kong and United Kingdom. China's export values to the USA, Hong Kong and United Kingdom in 2013 are 4.315 billion US dollars, 0.891 billion US dollars and 0.726 billion US dollars respectively, an increase of 12.17%, 8.6% and 12.43% compared with 2010. Among the twenty export markets above, the export value of China to Singapore increased the most, an increase of 232.02% in 2013 compared with 2011.
2011-2013 China Toy Export Market Share Analysis
| No. | Countries/Regions | Value Percentage | ||
|
|
| 2011 | 2012 | 2013 |
| 1 | USA↓ | 35.53% | 35.23% | 34.84% |
| 2 | Hong Kong | 7.58% | 7.04% | 7.20% |
| 3 | United Kingdom | 5.97% | 6.04% | 5.87% |
| 4 | Japan | 4.53% | 4.59% | 4.51% |
| 5 | Germany↓ | 4.42% | 3.98% | 3.86% |
| 6 | Philippines | 4.08% | 3.39% | 3.66% |
| 7 | Singapore↑ | 0.91% | 2.27% | 2.65% |
| 8 | Russian Federation↑ | 1.92% | 2.28% | 2.54% |
| 9 | Canada | 2.36% | 2.28% | 2.31% |
| 10 | France↓ | 2.89% | 2.69% | 2.30% |
| 11 | Mexico | 2.19% | 2.15% | 2.29% |
| 12 | Australia | 2.11% | 2.30% | 2.29% |
| 13 | Netherlands | 2.23% | 1.98% | 1.98% |
| 14 | Republic of Korea↑ | 1.22% | 1.52% | 1.64% |
| 15 | Belgium | 1.31% | 1.19% | 1.55% |
| 16 | Italy↓ | 2.19% | 1.73% | 1.48% |
| 17 | Spain↓ | 1.79% | 1.51% | 1.42% |
| 18 | Brazil↑ | 1.31% | 1.35% | 1.37% |
| 19 | Chile | 1.16% | 1.20% | 1.20% |
| 20 | United Arab Emirates | 1.35% | 1.50% | 1.18% |
Note: “↑”represents that the indicators listed continued to increase from 2011 to 2013, “↓”represents that the indicators listed continued to decrease from 2011 to 2013.
The data of 2013 shows that the USA, Hong Kong and United Kingdom, the three largest export markets of toys from China, accounted for 34.84%, 7.2% and 5.87% of the total export value respectively.
Judging from the three-year market share, the proportion of import value for Singapore, the Russian Federation, the Republic of Korea and Brazil continued to rise, while that of the USA, Germany, France, Italy and Spain continued to decline.


