2009-2011 Global Toy Industry Export Situation
2011 Global Major Toy Import Situation(Sorted by 2011 Import Value)
| Product Name | Import Value in 2011(thousand U.S. dollars) | Year-On-Year |
| HS Code 950300:Tricycles, scooters, pedal cars and similar wheeled toys; dolls' carriages | 39,796,256 | 5.98% |
| HS Code 950390:Toys nesoi | 63,666 | -38.74% |
| HS Code 950380:Toys and models, incorporating a motor | 8,847 | -64.13% |
| HS Code 950330:Construction sets and constructional toys, nesoi | 7,262 | -57.26% |
| HS Code 950349:Toys (except stuffed) representing animals or non-human creatures (for example, robots and monsters) and parts and accessories thereof | 4,780 | -70.79% |
| HS Code 950341:Stuffed toys representing animals or non-human creatures | 4,748 | -71.05% |
| HS Code 950370:Toys, put up in sets or outfits | 3,649 | -83.62% |
| HS Code 950350:Toy musical instruments and apparatus | 2,484 | -64.50% |
| HS Code 950320:Reduced-size (scale) model assembly kits, working models or not, excluding electric trains; parts and accessories thereof | 1,934 | -72.39% |
| HS Code 950360:Puzzles | 1,180 | -79.50% |
| HS Code 950310:Electric trains, including tracks, signals and other accessories thereof | 914 | -66.62% |
| Total | 39,895,721 | 5.62% |
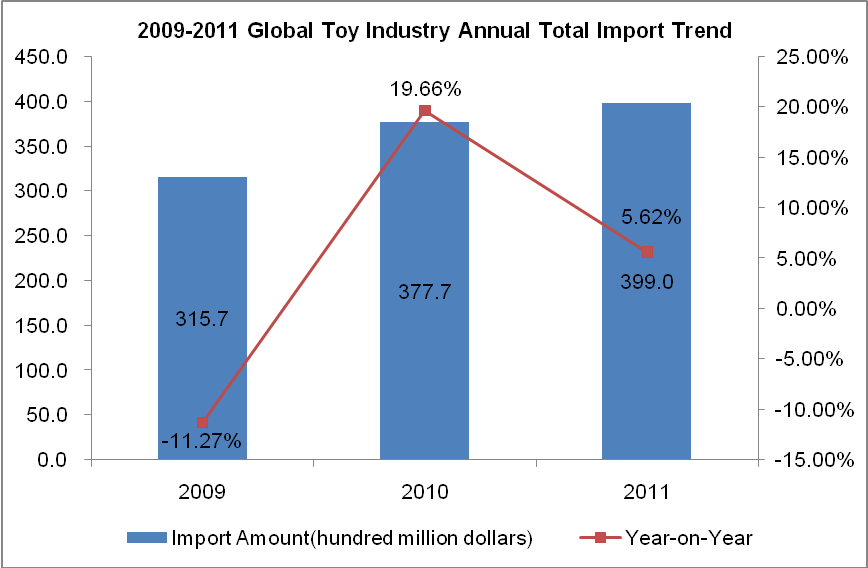
2009-2011 Global Toy Industry Annual Total Import Trend

2009-2011 the total global toy import upward trend, imports amounted to $ 31.57 billion (down 11.27%), $ 37.77 billion (an increase of 19.66%) and $ 39.9 billion (an increase of 5.62%).
2009-2011 Global Toy Main Demand Countries / Regions Import Value (Sorted by 2011 Import Value)
| No. | Import Country/Region | Import Value(thousand U.S. dollars) | ||
|
|
| 2009 | 2010 | 2011 |
| 1 | USA | 9,828,948 | 11,916,515 | 11,527,881 |
| 2 | Germany | 2,119,325 | 2,275,505 | 2,669,542 |
| 3 | United Kingdom | 1,953,830 | 2,437,715 | 2,360,489 |
| 4 | Hong Kong | 2,092,625 | 2,285,455 | 2,228,510 |
| 5 | France | 1,500,495 | 1,803,227 | 2,015,203 |
| 6 | Japan | 1,518,025 | 1,659,572 | 1,905,208 |
| 7 | Canada | 970,974 | 1,198,852 | 1,209,874 |
| 8 | Italy | 986,553 | 1,122,331 | 1,199,503 |
| 9 | Belgium | 918,513 | 937,782 | 1,001,678 |
| 10 | Russian Federation | 417,534 | 865,279 | 986,733 |
| 11 | Spain | 805,910 | 926,920 | 913,537 |
| 12 | Australia | 636,195 | 772,734 | 853,353 |
| 13 | Mexico | 496,354 | 688,635 | 810,379 |
| 14 | Netherlands | 643,593 | 747,661 | 771,262 |
| 15 | Czech | 495,753 | 610,385 | 763,661 |
| 16 | Poland | 395,755 | 460,268 | 502,840 |
| 17 | Turkey | 193,809 | 285,557 | 419,339 |
| 18 | Korea | 256,959 | 319,138 | 407,499 |
| 19 | Austria | 332,345 | 345,215 | 398,002 |
| 20 | Brazil | 231,900 | 313,257 | 396,993 |
2009-2011 Global Toy Main Demand Countries / Regions Market Share (Sorted by 2011 Import Value)
| No. | Import Country/Region | Import Value Proportion (%) | ||
|
|
| 2009 | 2010 | 2011 |
| 1 | USA | 31.14% | 31.55% | 28.90% |
| 2 | Germany | 6.71% | 6.02% | 6.69% |
| 3 | United Kingdom | 6.19% | 6.45% | 5.92% |
| 4 | Hong Kong↓ | 6.63% | 6.05% | 5.59% |
| 5 | France↑ | 4.75% | 4.77% | 5.05% |
| 6 | Japan | 4.81% | 4.39% | 4.78% |
| 7 | Canada | 3.08% | 3.17% | 3.03% |
| 8 | Italy | 3.13% | 2.97% | 3.01% |
| 9 | Belgium | 2.91% | 2.48% | 2.51% |
| 10 | Russian Federation↑ | 1.32% | 2.29% | 2.47% |
| 11 | Spain↓ | 2.55% | 2.45% | 2.29% |
| 12 | Australia↑ | 2.02% | 2.05% | 2.14% |
| 13 | Mexico↑ | 1.57% | 1.82% | 2.03% |
| 14 | Netherlands↓ | 2.04% | 1.98% | 1.93% |
| 15 | Czech↑ | 1.57% | 1.62% | 1.91% |
| 16 | Poland | 1.25% | 1.22% | 1.26% |
| 17 | Turkey↑ | 0.61% | 0.76% | 1.05% |
| 18 | Korea↑ | 0.81% | 0.84% | 1.02% |
| 19 | Austria | 1.05% | 0.91% | 1.00% |
| 20 | Brazil↑ | 0.73% | 0.83% | 1.00% |
Note: ↑behalf 2009-2011 export value accounted for the proportion of total world exports continued to rise, ↓represents the 2009-2011 export value accounted for the proportion of total world exports continued to decline.
In 2011,the top 20 global toys demand countries / regions are the United States, Germany, Britain, Hong Kong, France, Japan, Canada, Italy, Belgium, the Russian Federation, Spain, Australia, Mexico, the Netherlands, the Czech Republic, Poland, Turkey, South Korea , Austria and Brazil, in 2011 this 20 countries / regions imports accounted for 83.57 % of total world imports. Which for three consecutive years, Three consecutive years 2009-2011,the increased share of imports countries / regions are France, the Russian Federation, Australia, Mexico, the Czech Republic, Turkey, South Korea and Brazil; 2009-2011 shares of imports declined for three consecutive years the countries / regions are Hong Kong, Spain and the Netherlands.


