| No. | Countries/Regions | Jan. to August Total | Year on Year | ||
| Volume (Piece) | Value (USD) | Volume | Value | ||
| 1 | USA | 405,853 | 1,685,648,940 | -13.3% | -12.1% |
| 2 | Hong Kong | 328,020 | 1,095,181,913 | -5.1% | -13.8% |
| 3 | UK | 85,699 | 440,985,270 | 3.1% | -6.7% |
| 4 | Denmark | 75,175 | 356,302,602 | -60.2% | -62.3% |
| 5 | Singapore | 95,539 | 262,762,268 | 79.2% | 64.5% |
| 6 | Germany | 77,048 | 216,936,471 | -2% | -1.2% |
| 7 | Taiwan | 55,208 | 212,733,393 | 449.9% | 807.6% |
| 8 | Japan | 327,453 | 147,798,047 | 51.7% | 74.8% |
| 9 | Bermuda | 15,388 | 132,715,300 | 4.8% | 7.4% |
| 10 | Netherlands | 10,513 | 125,468,713 | -27.5% | 29% |
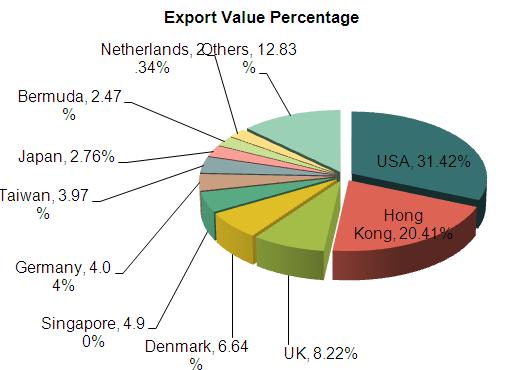
Our country's containers export value amounted to about 5.365 billion US dollars from Jan. to August in 2013, with a decrease of 9.6% year on year. Main export countries/regions are the United States, Hong Kong, the United Kingdom, Denmark, Singapore, Germany, Taiwan, Japan, Bermuda and the Netherlands and so on. The United States is China containers' key export market. The export value to the United States accounted about 31.42% of the total export value of the product. From Jan. to August in 2013, among the top ten export markets, Taiwan China containers export grew the fastest, China's export value to Taiwan increased by 807.6%.
Source: Customs Information Network


