| HS Code | Product Name |
| 8450 | Household or laundrytype washing machines, including machines which both wash and dry, the following text referred to as "washing machine" |
Chinese Washing Machine (HS: 8450) Export Volume and Value from Jan. to May in 2013
| Month | Volume (-) | Value (USD) | Year on Year | |
| Volume | Value | |||
| January | 6,763,260 | 305,888,446 | 6.9% | 10.6% |
| February | 4,948,960 | 237,299,627 | -4.3% | -1.4% |
| March | 6,378,751 | 347,156,317 | -14% | 14.9% |
| April | 6,412,517 | 325,318,836 | -13.1% | 11.1% |
| May | 7,133,026 | 328,283,860 | -6.7% | 0.2% |
| Jan.-May Total | 31,636,514 | 1,543,947,086 | -6.8% | 7.2% |
Chinese Washing Machine export value amounted to 1.544 billion U.S. dollars from Jan. to May in 2013, with an increase of 7.2%.
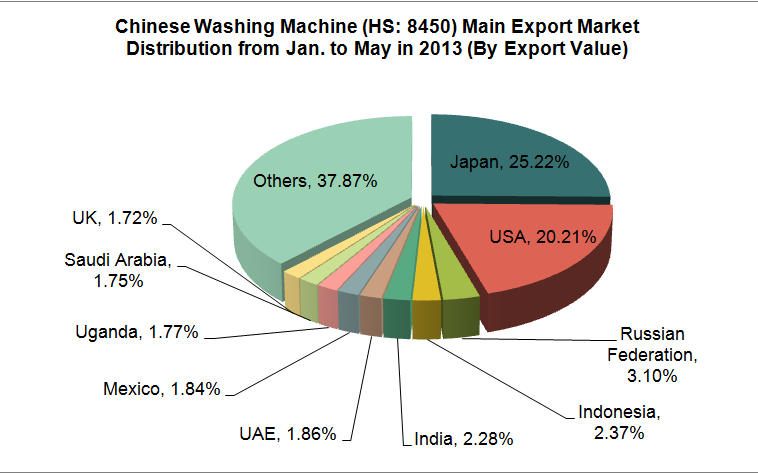
Chinese Washing Machine (HS: 8450) Main Export Countries/Regions Distribution from Jan. to May in 2013
| No. | Country | Volume (-) | Value (USD) | Year on Year | |
| Volume | Value | ||||
| 1 | Japan | 7,659,045 | 389,364,786 | -9.8% | -8.1% |
| 2 | USA | 3,334,938 | 312,005,836 | 38.8% | 242.3% |
| 3 | Russian Federation | 2,233,460 | 47,877,447 | 66.8% | -37.6% |
| 4 | Indonesia | 1,549,976 | 36,644,104 | 22.5% | 12.4% |
| 5 | India | 927,910 | 35,163,611 | -9.1% | 0.1% |
| 6 | UAE | 440,534 | 28,768,430 | -6.5% | -16.6% |
| 7 | Mexico | 754,353 | 28,377,230 | -17.2% | 28.1% |
| 8 | Uganda | 216,783 | 27,396,852 | 5.2% | 27.1% |
| 9 | Saudi Arabia | 437,027 | 26,994,957 | 17.9% | 15.9% |
| 10 | UK | 151,008 | 26,606,076 | -41.4% | -21.3% |

From Jan. to May in 2013, among the top ten export destination countries/regions, from the export volume year on year, there was a larger increase in Russian Federation (with an increase of 66.8% year on year). From the export value year on year, there was a larger increase in USA (with an increase of 242.3% year on year).
Chinese Washing Machine (HS: 8450) Main Export Source Area from Jan. to May in 2013
| No. | Region | Volume (-) | Value (USD) | Year on Year | |
| Volume | Value | ||||
| 1 | Jiangsu | 8,454,834 | 720,145,236 | 7.6% | 40.7% |
| 2 | Zhejiang | 11,375,094 | 296,230,184 | -7.6% | -13.3% |
| 3 | Guangdong | 3,173,517 | 182,475,798 | -8.6% | -3% |
| 4 | Shanghai | 4,016,530 | 168,149,399 | -12.1% | -13.4% |
| 5 | Anhui | 1,597,182 | 89,243,383 | -37.6% | -12.5% |
| 6 | Shandong | 1,300,434 | 67,443,915 | 13.6% | -15.4% |
| 7 | Tianjin | 959,965 | 13,854,250 | -16.8% | -5.7% |
| 8 | Fujian | 183,950 | 1,563,909 | -31.4% | -26.6% |
| 9 | Beijing | 154,181 | 1,527,816 | 38.5% | 93.6% |
| 10 | Inner Mongolia Autonomous Region | 13,531 | 962,888 | -7.2% | -10.5% |
Jiangsu, Zhejiang, Guangdong and Shanghai are our Washing Machine main export source area. The Washing Machine export volume of the above four provinces accounted for 85.41% of total export volume from Jan. to May in 2013, and the export value together accounted for 88.54% of total export value. Among Our top ten Washing Machine export source areas, there was the largest increase of both export volume and value in Beijing Province, with an increase of 38.5% year on year of export volume and 93.6% year on year of export value.
(Source: China Customs)


