China Electro-Mechanical Domestic Appliance Export Volume & Value
| Month | Volume | Value(USD) | Y-o-Y | |
| Volume | Value | |||
| Jan. | 43,568,808 | 441,097,927 | 18.60% | 5.70% |
| Feb. | 36,031,825 | 376,271,511 | 103.80% | 84.40% |
| Mar. | 26,907,720 | 298,091,758 | -5.70% | -10.60% |
| Apr. | 40,391,854 | 418,858,171 | 10.20% | -1.80% |
| May | 43,737,636 | 445,378,728 | 14.70% | -1.70% |
| Jun. | 41,669,627 | 435,795,237 | 19.40% | 4.60% |
| Jul. | 43,753,953 | 448,225,290 | 7.30% | -4.60% |
| Aug. | 50,398,524 | 513,493,089 | 11.70% | -0.50% |
| Sep. | 49,055,770 | 525,619,287 | 11.60% | 4.50% |
| Total | 375,515,717 | 3,902,830,998 | 16.40% | 4.40% |
From January to September in 2015,China electro-mechanical domestic appliance export value reached USD 3903 million, up 4.4% by year, while the export volume was16.4% higher than that in the same period of last year.
Major Regions for China’s Electro-Mechanical Domestic Appliance Export
| No. | Country/Region | Volume | Value(USD) | Y-o-Y | |
| Volume | Value | ||||
| 1 | America | 120,963,161 | 1,216,383,553 | 24.80% | 13.40% |
| 2 | Germany | 25,741,609 | 259,194,317 | 21.10% | 23.90% |
| 3 | England | 17,635,500 | 188,215,959 | 10.30% | 19.80% |
| 4 | Japan | 15,744,884 | 178,911,676 | 10.20% | 0.10% |
| 5 | Hong Kong | 13,739,688 | 168,097,275 | -16.60% | -16.60% |
| 6 | Italy | 10,701,875 | 154,529,602 | 24.50% | 10.40% |
| 7 | Netherlands | 12,321,489 | 133,866,469 | 6.30% | 2.80% |
| 8 | France | 11,169,205 | 125,524,285 | 5.70% | -4.80% |
| 9 | Canada | 8,826,189 | 100,930,608 | 24% | 0.10% |
| 10 | Australia | 8,924,628 | 99,847,392 | 13.30% | 1.30% |
| 11 | UAE | 7,257,246 | 89,527,542 | -19% | -19.80% |
| 12 | Brazil | 6,603,459 | 68,580,974 | 6.90% | -0.40% |
| 13 | Korea | 5,256,686 | 66,280,645 | 18.60% | -56.10% |
| 14 | Spain | 7,834,152 | 64,488,315 | 15.10% | 17.30% |
| 15 | Belgium | 4,877,774 | 64,464,587 | 11.30% | 20% |
| 16 | Russia | 7,680,772 | 54,401,926 | -3.70% | -31.70% |
| 17 | Saudi Arabia | 2,940,868 | 46,897,114 | 33.60% | 33.30% |
| 18 | Poland | 5,263,120 | 37,482,174 | 49.90% | 44.10% |
| 19 | Slovenia | 3,762,490 | 34,314,678 | 20.10% | 16.60% |
| 20 | Swedish | 2,113,965 | 31,817,583 | 12.10% | -7.50% |

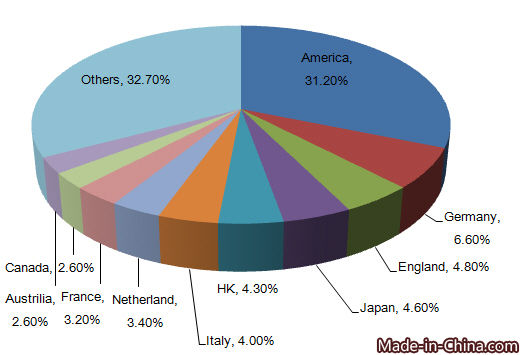
From January to September in 2015, the export data shows that America, Germany, England, Japan, Hong Kong, Italy, Netherlands, France, Canada and Australia topped the country list for China’s electro-mechanical domestic appliance export. America is the largest export market for China’s electro-mechanical domestic appliance, the export value to America accounted for 31.2% of China’s total export value.
From January to September in 2015, in the top 20 export markets, the export value to Poland grew fastest, 44.1% higher than that in 2014.
China’s Electro-Mechanical Domestic Appliance Origins
| No. | Region | Volume | Value(USD) | Y-O-Y | |
| Volume | Value | ||||
| 1 | Guangdong | 246,878,628 | 2,792,017,066 | 17.80% | 5% |
| 2 | Zhejiang | 76,153,055 | 559,071,050 | 12.90% | 5.40% |
| 3 | Fujian | 28,737,948 | 168,175,102 | 6.60% | 22.70% |
| 4 | Jiangsu | 4,906,598 | 116,540,873 | 7.60% | 10.30% |
| 5 | Anhui | 1,142,958 | 98,601,809 | -30.60% | -44.40% |
| 6 | Shanghai | 9,793,150 | 67,796,553 | 31.70% | 4.70% |
| 7 | Jiangxi | 3,622,363 | 42,873,495 | 76.30% | 81.60% |
| 8 | Guizhou | 1,387,163 | 12,382,947 | 5.10% | 11% |
| 9 | Shandong | 433,409 | 8,690,376 | 26.30% | -16.60% |
| 10 | Jilin | 65,707 | 6,297,877 | 40.30% | 13.70% |
Guangdong and Zhejiang are the major regions for China’s electro-mechanical domestic appliance export. From January to September in 2015, the total export volume from these two provinces accounted for 86.0% of the total, while the total export value accounted for 85.9% of the total.