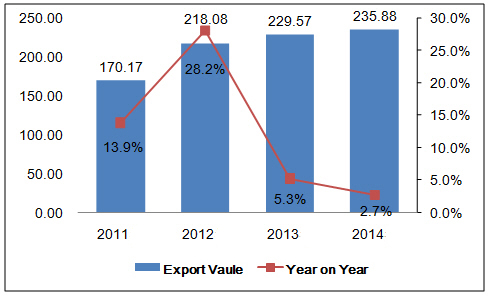
China Seats & Parts Export Trend in 2011-2014

China seats & parts export trend had a tendency to increase from 2011 to 2014. Export value of 2014 was USD 23588 million, up 38.6% than 2011.
China Seats & Parts Export Volume and Value from Q1 to Q3 in 2015
| Month | Volume | Value(kg) | Y-O-Y | |
| Volume | Value | |||
| Jan. | 126,422,761 | 2,601,800,974 | 1% | -0.10% |
| Feb. | 106,046,929 | 2,135,542,376 | 73.80% | 91.80% |
| Mar. | 82,652,347 | 1,487,049,341 | -17.20% | -16.50% |
| Apr. | 113,967,519 | 1,992,891,763 | 0.90% | -3.10% |
| May. | 114,636,521 | 2,044,085,986 | 1.80% | 0.90% |
| Jun. | 101,254,029 | 1,875,222,682 | 4.70% | 3.50% |
| Jul. | 98,389,746 | 1,791,301,681 | -3% | -9.10% |
| Aug. | 96,190,682 | 1,744,607,660 | 0.90% | -8.70% |
| Sep. | 92,315,856 | 1,728,197,483 | 1% | -4.10% |
| Total | 931,876,390 | 17,400,699,946 | 4% | 1.90% |
China seats & parts exports value in the first 3 quarters reached USD 17.4 billion, up 1.9% by year.
Distribution of major Countries for China’s Seats & Parts Exports
| No. | Country | Volume | Value(USD) | Y-O-Y | |
| Volume | Value | ||||
| 1 | America | 316,472,007 | 5,794,570,830 | 8.30% | 10.30% |
| 2 | Japan | 63,230,429 | 1,151,483,278 | -2.90% | -4.30% |
| 3 | England | 38,115,085 | 956,342,905 | 9.40% | 11% |
| 4 | Germany | 46,820,650 | 782,965,020 | -1.30% | 0.90% |
| 5 | Australia | 19,666,187 | 608,946,955 | 3.20% | 1.70% |
| 6 | Canada | 28,162,634 | 594,476,190 | -6.70% | 0.90% |
| 7 | Korea | 23,520,832 | 588,028,027 | -3.20% | 17.50% |
| 8 | Singapore | 8,553,514 | 421,698,316 | -7.70% | 8.60% |
| 9 | France | 17,242,092 | 417,854,064 | -2.90% | -4.70% |
| 10 | Netherland | 15,909,893 | 385,098,987 | 7.90% | 2.70% |
| 11 | Saudi Arabia | 10,904,403 | 368,205,822 | 37.40% | 25.90% |
| 12 | Malaysia | 18,429,533 | 304,646,921 | -19.90% | -38.90% |
| 13 | UAE | 8,790,946 | 299,076,394 | -19% | -22.80% |
| 14 | India | 22,960,759 | 249,985,360 | 54.40% | 26.20% |
| 15 | Spain | 20,048,541 | 241,605,071 | 10.50% | 6.10% |
| 16 | Thailand | 13,050,800 | 235,524,240 | 50.80% | 52.90% |
| 17 | Italy | 20,199,318 | 200,945,157 | -5.70% | -7.50% |
| 18 | Mexico | 17,672,390 | 188,728,909 | 18.50% | 3.70% |
| 19 | Hong Kong | 8,661,871 | 178,207,190 | -21.30% | -13.80% |
| 20 | Belgium | 7,732,719 | 156,523,281 | -8.20% | -9.20% |

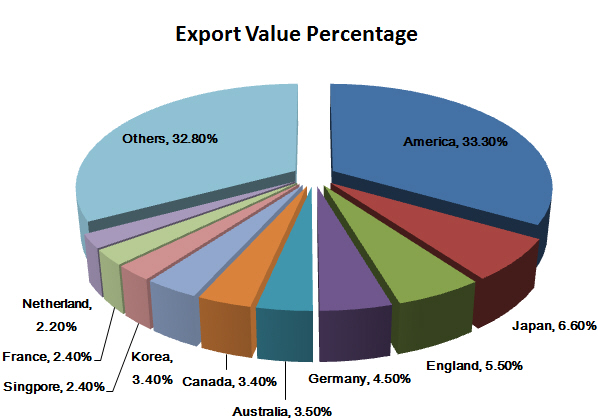
The export data above shows that America, Japan, England, Germany, Australia, Canada, Korea, Singapore, France and Netherland are the main markets for China’s seats & parts export. America ranks first in these countries, followed by Japan and England. During this period, exports to Thailand grew the fastest in the top 20 countries and the growth was 52.9%.
China’s Seats & Parts Export Origins from Jan. to Sep
| No. | Region | Volume | Value(USD) | Y-O-Y | |
| Volume | Value | ||||
| 1 | Guangdong | 282,637,410 | 7,570,954,005 | 7.90% | 0.60% |
| 2 | Zhejiang | 322,541,472 | 5,085,471,677 | 1.50% | 5% |
| 3 | Jiangsu | 110,512,440 | 1,401,418,633 | 6.40% | 5.40% |
| 4 | Shanghai | 61,476,161 | 963,655,307 | -5.20% | -5.60% |
| 5 | Shandong | 31,436,152 | 546,338,304 | 12.40% | 8.80% |
| 6 | Fujian | 51,974,145 | 533,670,140 | -1.20% | -17.10% |
| 7 | Hubei | 26,334,850 | 372,351,362 | 9.40% | 8.20% |
| 8 | Tianjin | 9,582,863 | 156,786,728 | 10.40% | -3% |
| 9 | Jiangxi | 4,297,936 | 148,888,104 | -13.70% | -3.40% |
| 10 | Liaoning | 4,871,576 | 111,945,397 | 8.60% | 3.80% |
| 11 | Chongqing | 2,597,359 | 78,442,218 | 29.90% | 165.80% |
| 12 | Beijing | 1,706,222 | 66,848,178 | -21.80% | -3.80% |
| 13 | Anhui | 2,683,320 | 64,200,146 | -17.90% | 2.10% |
| 14 | Hubei | 6,479,651 | 58,943,292 | 30.80% | 24.30% |
| 15 | Hunan | 2,219,821 | 54,245,427 | 19.10% | 74.90% |
| 16 | Jilin | 1,684,857 | 30,146,744 | 54.70% | 28.10% |
| 17 | Sichuan | 394,999 | 28,130,174 | -35.60% | -11.70% |
| 18 | Henan | 1,017,867 | 27,201,464 | 17.90% | 67.50% |
| 19 | Yunnan | 304,911 | 19,454,144 | 120.80% | 185.60% |
| 20 | Xinjiang | 1,095,169 | 19,159,047 | -42.70% | -43% |

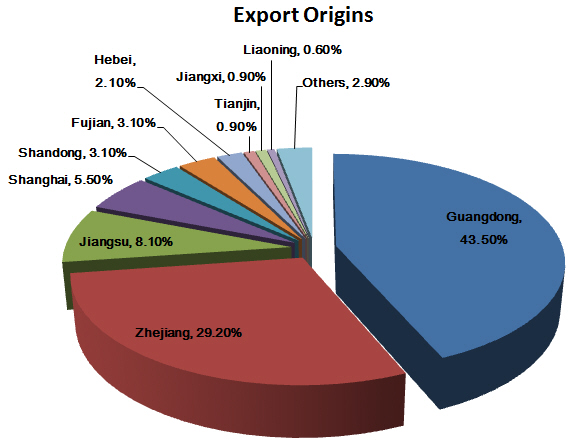
Guangdong, Zhejiang and Jiangsu are the major origins for China’s seats & parts export. By the end of Q3, seats & parts export volume of the three provinces accounted for 76.8% of the total. In the top 20 export origins, Yunnan’s export grew the fastest. Hainan’s average export price was the highest (210.71 USD/-) and Guangxi’s was the lowest (3.33 USD/-)


