China’s Lavatory Seats and Covers Export Volume and Value
| Month | Volume(kg) | Value(USD) | Y-o-Y | |
| Volume | Value | |||
| January | 8,368,050 | 35,899,393 | 3.60% | 5.60% |
| February | 6,639,737 | 28,564,814 | 102.70% | 101.40% |
| March | 4,704,692 | 20,031,257 | -12.30% | -12.40% |
| April | 7,830,814 | 34,007,480 | 16.70% | 19.20% |
| May | 7,909,887 | 35,410,551 | 19.20% | 16.10% |
| June | 7,680,928 | 34,061,924 | 5.50% | 7.40% |
| July | 6,704,398 | 29,481,664 | -13.20% | -15.40% |
| August | 6,753,622 | 29,431,951 | -9.30% | -10.80% |
| September | 6,300,447 | 30,524,770 | -8.90% | -5.40% |
| October | 6,291,499 | 30,061,096 | -7.30% | -5% |
| November | 5,932,589 | 31,665,762 | -20.30% | -1.60% |
| December | 7,819,291 | 35,522,442 | -0.60% | -3.40% |
| Total | 82,935,954 | 374,663,104 | 1.70% | 3.40% |
From January to December in 2015, China’s lavatory seats and covers export volume was
82900 tons, up 1.7% and export value was USD 375,000,000, up 3.4% on year.
Major Markets for China’s Lavatory Seats and Covers Export
| No. | Country | Volume(kg) | Value(USD) | Y-o-Y | |
| Volume | Value | ||||
| 1 | The United States | 16,397,069 | 74,100,553 | -2.90% | 19.10% |
| 2 | Germany | 8,957,185 | 33,510,144 | 9% | 13.50% |
| 3 | The United Kingdom | 7,012,881 | 31,176,437 | 7.80% | 7.20% |
| 4 | Netherland | 3,704,659 | 15,438,188 | -15.80% | -18.80% |
| 5 | Thailand | 3,244,893 | 14,466,431 | 10.10% | 9.70% |
| 6 | France | 3,552,821 | 13,339,460 | 13.40% | 0.80% |
| 7 | Australia | 2,312,163 | 12,699,662 | 20.80% | 13.10% |
| 8 | Mexico | 2,242,062 | 11,376,816 | -0.10% | 1.20% |
| 9 | Brazil | 2,075,599 | 10,942,142 | -10.10% | 11.80% |
| 10 | Poland | 2,175,808 | 8,971,162 | 26.50% | 22% |

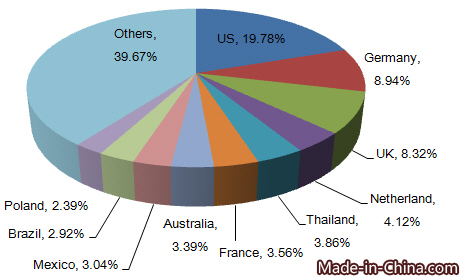
From January to December in 2015, the United States, Germany and the United Kingdom were top three markets for China’s lavatory seats and covers. Other export markets were Netherland, Thailand, France, Australia, Mexico, Brazil and Poland.
China’s Export Origins of Lavatory Seats and Covers
| No. | Province | Volume(kg) | Value(kg) | Y-o-Y | |
| Volume | Value | ||||
| 1 | Guangdong | 26,120,340 | 131,238,370 | -2% | -1.30% |
| 2 | Fujian | 25,601,105 | 115,317,349 | 15.20% | 7.50% |
| 3 | Zhejiang | 12,216,118 | 52,417,199 | -0.20% | 19.70% |
| 4 | Jiangsu | 9,528,433 | 31,817,863 | 8.10% | 5.90% |
| 5 | Hebei | 4,909,204 | 19,737,282 | -30.50% | -32.20% |
| 6 | Shanghai | 3,041,128 | 12,303,825 | 15.70% | 19.40% |
| 7 | Chongqing | 170,707 | 3,355,845 | 66.60% | 88.60% |
| 8 | Guangxi | 31,801 | 1,208,324 | 25546% | 196056.50% |
| 9 | Jiangxi | 171,905 | 1,127,576 | -58% | 9.10% |
| 10 | Hunan | 90,600 | 978,044 | 82% | 171.50% |
Guangdong and Fujian were China’s main export origins of lavatory seats and covers. From January to December in 2015, the export value from the two provinces accounted for 62.36% of China’s total. Guangdong’s export volume accounted for 31.49% of total and Fujian’s accounted for 30.87%.


