China’s Medical Surgery and Dental Furniture Export Trend
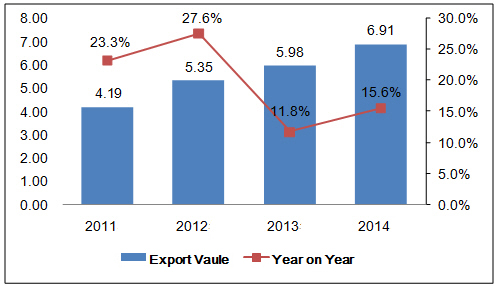
According to the data above, China’s medical furniture export increased year by year from 2011 to 2014 and the export value in 2014 was USD 690 million, 64.8% higher than 2011.
China’s Medical Furniture Export Volume & Value
| Month | Volume(Units) | Value(USD) | Y-O-Y | |
| Volume | Value | |||
| Jan | 3,806,711 | 75,152,346 | 672.50% | 20.10% |
| Feb | 5,684,674 | 88,631,269 | 368.40% | 196.80% |
| Mar | 2,125,439 | 43,262,690 | -13.50% | -3.90% |
| Apr | 3,334,104 | 53,874,885 | 0.70% | 7.70% |
| May | 3,618,350 | 60,927,766 | -19.40% | 19.40% |
| Jun | 4,715,476 | 59,028,528 | 31.60% | 6.70% |
| Jul | 4,382,869 | 71,582,333 | 7.10% | 15% |
| Aug | 4,216,073 | 62,383,322 | 4.60% | -0.50% |
| Sep | 3,212,371 | 61,058,180 | -21.60% | 0.70% |
| Total | 35,096,067 | 575,901,319 | 26.40% | 20.10% |
From January to September in 2015, the export value reached USD 576 million, increasing 20.1% by year.
Major countries for China’s Medical Furniture Export by the end of Q3
| No. | Countries | Volume(Units) | Value(USD) | Y-O-Y | |
| Volume | Value | ||||
| 1 | America | 15,252,221 | 124,322,068 | 19.70% | 29.90% |
| 2 | Japan | 775,675 | 33,989,560 | 4.40% | -11.60% |
| 3 | England | 1,501,305 | 31,156,488 | 87% | -3.90% |
| 4 | Malaysia | 1,139,896 | 26,654,009 | 230.90% | 160.40% |
| 5 | Singapore | 567,908 | 20,343,672 | 667.70% | 175.20% |
| 6 | India | 573,910 | 19,721,380 | 219.30% | 45% |
| 7 | Indonesia | 658,969 | 16,925,595 | 211.50% | 46.10% |
| 8 | Australia | 260,947 | 15,742,834 | 28.40% | 22.50% |
| 9 | Germany | 478,488 | 15,548,763 | -14.60% | 22.90% |
| 10 | Saudi Arabia | 455,396 | 14,418,564 | 473.40% | 31.40% |
| 11 | Thailand | 326,836 | 13,812,752 | 482.70% | 54% |
| 12 | Bangladesh | 451,329 | 12,631,500 | 208% | 650.10% |
| 13 | Ecuador | 19,040 | 12,573,572 | 26.80% | 755.80% |
| 14 | France | 3,215,293 | 11,811,157 | 17.70% | 1% |
| 15 | Netherland | 366,959 | 11,108,589 | 36.10% | 21.50% |
| 16 | Hong Kong | 2,845,474 | 10,853,488 | 0.50% | 28.90% |
| 17 | UAE | 189,049 | 10,033,997 | 99.10% | 26.80% |
| 18 | Philippines | 248,675 | 9,721,024 | 330.30% | 65.80% |
| 19 | Italy | 773,511 | 9,340,609 | -39.20% | -20% |
| 20 | Canada | 870,850 | 7,564,725 | 137.70% | 35.10% |
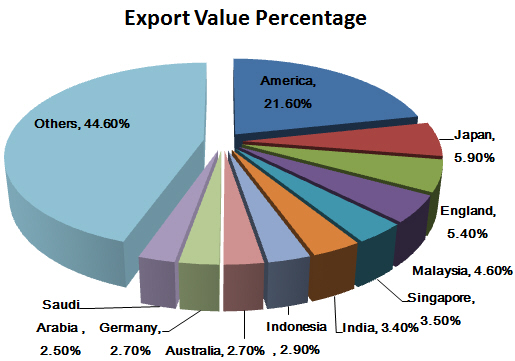
According to the export data, America, Japan, England, Malaysia, Singapore and India were the major countries for China’s medical furniture export. America ranked first in the list, followed by Japan and England. By the end of Q3 in 2015, China’s medical furniture exports to Ecuador grew the fastest and the growth was 755.8%.
China’s Medical Furniture Export Origins
| No. | Region | Volume(Units) | Value(USD) | Y-O-Y | |
| Volume | Value | ||||
| 1 | Guangdong | 10,718,985 | 219,050,683 | 31.80% | 25.40% |
| 2 | Jiangsu | 13,112,256 | 106,965,545 | 23% | -13.60% |
| 3 | Zhejiang | 5,501,643 | 62,639,559 | -2.30% | 16.70% |
| 4 | Shanghai | 1,619,630 | 52,770,947 | 13.80% | 10.30% |
| 5 | Fujian | 1,114,689 | 21,871,215 | 33.40% | 0.20% |
| 6 | Chongqing | 855,527 | 20,245,888 | 14681% | 1790.10% |
| 7 | Beijing | 27,286 | 14,215,539 | -4.70% | -20.40% |
| 8 | Hebei | 115,976 | 13,742,637 | -60.20% | 24.40% |
| 9 | Yunnan | 506,500 | 12,190,188 | 3924% | 1767.30% |
| 10 | Hubei | 144,037 | 12,125,128 | 1210.60% | 681.10% |
| 11 | Sichuan | 397,197 | 9,709,264 | 109.50% | 374.20% |
| 12 | Jiangxi | 226,705 | 7,196,347 | 519.50% | 159.40% |
| 13 | Shandong | 107,318 | 7,158,336 | 16.20% | 21.60% |
| 14 | Tianjin | 337,562 | 4,833,902 | 33.50% | 3.10% |
| 15 | Liaoning | 84,943 | 3,460,523 | 181.10% | 47.70% |
| 16 | Hunan | 56,754 | 2,135,518 | 1% | 37% |
| 17 | Anhui | 42,580 | 1,607,963 | 105.70% | -13% |
| 18 | Inner Mongolia | 3,841 | 1,187,504 | -41.10% | 144.30% |
| 19 | Jiangxi | 91,301 | 1,008,596 | 18842.10% | 54.50% |
| 20 | Guizhou | 654 | 512,472 | -93.80% | -4.30% |
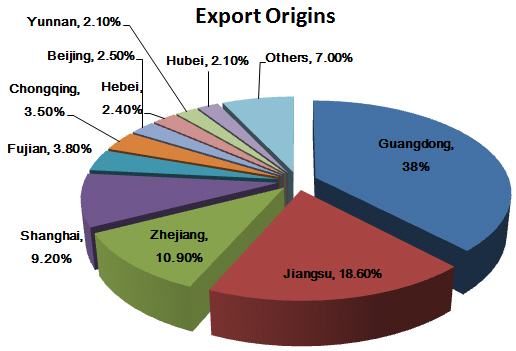
Guangdong, Jiangsu, and Zhejiang are China’s major medical furniture export origins. From January to September, the three provinces’ export volume accounted for 83.6% of the total. Chongqing ranked first in the list and its medical furniture export value increased 14681% by year.


