China's Golf Equipment Export Value & Volume from Jan. to Dec. in 2015
| Month | Volume(kg) | Value(USD) | Y-o-Y | |
| Volume | Value | |||
| Jan. | 1,133,099 | 63,123,127 | -24% | -17.70% |
| Feb. | 897,072 | 47,515,515 | 8.70% | 5% |
| Mar. | 768,586 | 48,004,209 | -35.70% | -25% |
| Apr. | 923,107 | 45,755,635 | -17.50% | -7.90% |
| May | 857,811 | 39,258,669 | -19.80% | -16.70% |
| Jun. | 801,417 | 35,648,125 | -0.90% | 4.70% |
| Jul. | 806,983 | 48,006,514 | -15% | 12.10% |
| Aug. | 860,070 | 47,223,485 | 4.60% | 16.70% |
| Sep. | 933,976 | 57,312,889 | 7.10% | 5% |
| Oct. | 955,433 | 53,085,422 | 5% | -14.30% |
| Nov. | 936,311 | 84,806,667 | -5.90% | 24.70% |
| Dec.. | 1,160,005 | 90,822,664 | 4.10% | 29.20% |
| Total | 11,033,870 | 660,562,921 | -9.30% | 0.90% |
In 2015, China's golf equipment export volume reached 11,000,000 kg, down 9.3% by year and export value was USD 660 million, up 0.9%.
Major Countries for China's Golf Equipment Export from Jan. to Dec. in 2015
| No. | Country/Region | Volume(kg) | Value(USD) | Y-o-Y | |
| Volume | Value | ||||
| 1 | HK | 3,473,599 | 357,296,876 | -12.80% | -3% |
| 2 | America | 3,708,582 | 113,100,050 | -4.60% | -9.40% |
| 3 | Japan | 1,311,660 | 74,575,467 | 12.90% | 11.40% |
| 4 | Mexico | 605,007 | 41,956,569 | 8.60% | 20.30% |
| 5 | Macau | 29,812 | 18,653,353 | 6009% | 1301599% |
| 6 | England | 582,547 | 16,671,583 | -4.80% | -12.40% |
| 7 | Vietnam | 148,513 | 4,814,250 | 49.70% | 51.20% |
| 8 | Korea | 170,631 | 4,623,355 | -18.70% | 12.90% |
| 9 | Taiwan | 62,107 | 4,094,697 | -26.40% | -26.80% |
| 10 | Malaysia | 44,592 | 3,888,810 | -24.20% | 269.60% |
| 11 | Australia | 134,565 | 3,577,292 | -21.10% | 9.60% |
| 12 | Singapore | 76,322 | 3,171,943 | -35.60% | 51.10% |
| 13 | Canada | 139,434 | 2,998,069 | 15.10% | 100.80% |
| 14 | Netherlands | 125,542 | 2,803,833 | -10.30% | -6.80% |
| 15 | Swedish | 60,555 | 961,852 | 32% | 73.60% |
| 16 | Germany | 47,536 | 951,718 | -25.40% | -22.10% |
| 17 | Indonesia | 7,428 | 655,682 | -52% | 193.80% |
| 18 | South Africa | 46,016 | 497,342 | -12.60% | -27.70% |
| 19 | Brunei | 9,437 | 488,841 | -40.20% | 139.50% |
| 20 | Belgium | 21,626 | 358,641 | 65.80% | 44% |

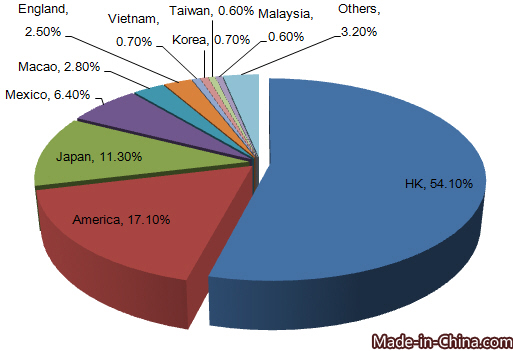
Major exporting countries for China's golf equipment were HK, America, Japan, Mexico, Macau, England, Vietnam, Korea, Taiwan and Malaysia in 2015. HK was the largest export market for China's golf equipment, followed by America and Japan. The export value to these three countries accounted for 54.1%, 17.1%, and 11.3% of China's golf equipment total export value respectively.
From January to December in 2015, in the top 20 export markets, the export value to Macau, Malaysia, Canada, Indonesia and Brunei grew faster than others, 1301599%, 269.6%, 100.8% and 139.5% higher than that in 2014 respectively.
Distribution of China's Golf Equipment Origins from Jan. to Dec. in 2015
| No. | Region | Volume(kg) | Value(USD) | Y-o-Y | |
| Volume | Value | ||||
| 1 | Guangdong | 7,999,722 | 584,114,808 | -11.80% | -0.10% |
| 2 | Shanghai | 483,677 | 22,193,421 | 19.70% | 18.50% |
| 3 | Fujian | 840,168 | 11,798,725 | -16.70% | -22.90% |
| 4 | Sichuan | 271,410 | 10,883,569 | -0.40% | 25.50% |
| 5 | Jiangsu | 456,011 | 10,180,585 | -4.60% | 9.20% |
| 6 | Jiangxi | 338,086 | 7,987,871 | -5.40% | 29.50% |
| 7 | Shanxi | 207,921 | 6,308,217 | 33.90% | 45.80% |
| 8 | Zhejiang | 223,068 | 2,359,225 | 53.60% | 70.20% |
| 9 | Beijing | 24,802 | 1,365,055 | 52% | -0.20% |
| 10 | Hunan | 36,843 | 727,910 | 100.70% | 113.60% |
Guangdong was the major origin for China's golf equipment export. From January to December in 2015, Guangdong's export volume accounted for 72.5% of China's golf equipment total export, while the export value accounted for 88.4% of the total. Shanghai's ranked second and the export volume accounted for 4.4% while the export value accounted for 3.4%.
From January to December in 2015, in the top 10 supply sources, Hunan's export volume grew fastest, up 113.6% by year. Zhejiang's ranked second, up 70.2% by year. Concerning the export price, Fujian's was the lowest, 14.04 dollars per kg and Guangdong's was the highest, 73.02 dollars per kg.


