Annual Export Trends of China's Knit or Crochet Apparel & Accessories
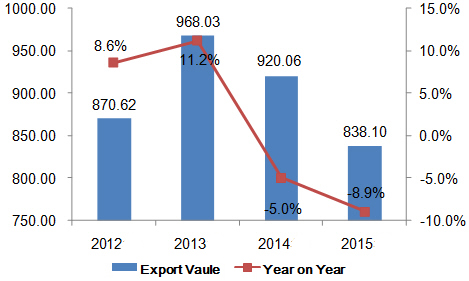
China's knit or crochet apparel & accessories export has trended down since 2013 during the period from 2012 to 2015. The export value in 2015 was USD 83,810,000,000, falling 8.9% on year.
Monthly Export Trends of China's Knit or Crochet Apparel & Accessories
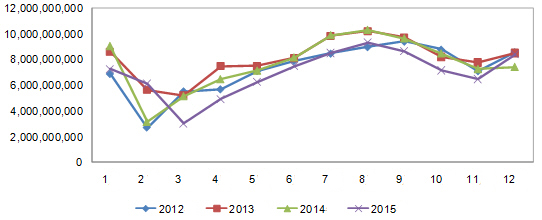
According to the chart above, from 2012 to 2015, China's knit or crochet apparel & accessories exports surged in the third quarter. In 2015, exports peak was in August and trough was in March.
China's Knit or Crochet Apparel & Accessories Export Volume & Value in 2015
| Month | Volume | Value(USD) | on Year | |
| Volume | Value | |||
| January | 3,538,749,889 | 7,280,883,355 | -15.20% | -19.40% |
| February | 3,066,284,177 | 6,122,171,505 | 95.70% | 94.50% |
| March | 1,550,972,249 | 3,050,621,834 | -39.70% | -40.70% |
| April | 2,695,680,179 | 4,952,656,762 | -19.40% | -23.40% |
| May | 3,201,215,766 | 6,271,989,482 | -10.90% | -12% |
| June | 3,417,142,135 | 7,517,547,745 | -5.60% | -7.80% |
| July | 3,648,216,658 | 8,509,269,872 | -12.90% | -13.80% |
| August | 4,054,815,176 | 9,335,726,948 | -5.60% | -9.20% |
| September | 3,823,664,926 | 8,673,154,107 | -5.70% | -10% |
| October | 3,214,155,171 | 7,173,743,772 | -14% | -15.20% |
| November | 2,861,719,300 | 6,509,857,347 | -13.30% | -10.30% |
| December | 3,617,743,318 | 8,412,432,275 | 6.40% | 13.40% |
| Total | 38,690,358,944 | 83,810,055,004 | -7.60% | -8.90% |
From January to December in 2015, China's knit or crochet apparel & accessories export value reached USD 83,810,055,004, falling 8.9% on year.
Export Destinations for China's Knit or Crochet Apparel & Accessories in 2015
| No. | Country/Region | Volume | Value(USD) | on Year | |
| Volume | Value | ||||
| 1 | United States | 7,700,657,476 | 17,564,999,347 | 8.10% | 8.20% |
| 2 | Japan | 3,714,202,938 | 8,828,463,320 | -9.50% | -12.70% |
| 3 | United Kingdom | 2,348,721,140 | 5,210,870,962 | 21.70% | 10% |
| 4 | Hong Kong | 1,015,131,865 | 3,564,869,586 | -30.60% | -31.40% |
| 5 | United Arab Emirates | 1,445,795,872 | 3,404,525,442 | -0.60% | 18.40% |
| 6 | Germany | 1,469,064,922 | 3,217,301,902 | -20.20% | -18.60% |
| 7 | Korea | 953,158,644 | 2,935,938,875 | 1% | 19.30% |
| 8 | Vietnam | 1,081,944,661 | 2,441,052,292 | -13.10% | -32.60% |
| 9 | Australia | 788,359,996 | 2,164,562,326 | 3.80% | 3.90% |
| 10 | Russia | 1,070,082,838 | 2,161,149,684 | -32.40% | -32.20% |
| 11 | France | 612,961,137 | 1,977,613,983 | -10.10% | -16% |
| 12 | Spain | 694,067,748 | 1,685,745,151 | -8.30% | -7.60% |
| 13 | Netherland | 977,894,569 | 1,641,985,105 | -25.60% | -34.40% |
| 14 | Canada | 654,071,499 | 1,376,851,346 | -1.50% | -5.30% |
| 15 | Italy | 468,844,739 | 1,268,230,356 | -13.40% | -18.70% |
| 16 | Chile | 952,610,087 | 1,187,588,678 | -2.80% | -11.10% |
| 17 | Malaysia | 561,540,773 | 1,127,388,737 | -11.70% | -10.50% |
| 18 | Philippines | 548,094,081 | 995,522,146 | 31.40% | 52.10% |
| 19 | Kyrgyzstan | 449,673,815 | 931,989,651 | -48.50% | -36.60% |
| 20 | Israel | 358,331,190 | 907,927,276 | 2.80% | 16.60% |
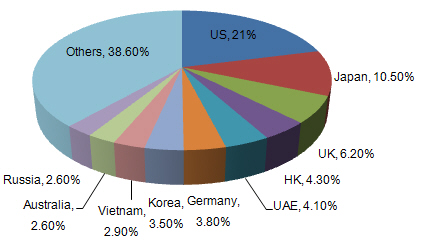
From January to December in 2015, the top export destinations of China's knit or crochet apparel & accessories were the United States, Japan, the United Kingdom, Hong Kong and United Arab Emirates. In 2015, China exports to Philippines grew faster than exports to other markets and the growth was 52.1% on year.
Export Origins of China's Knit or Crochet Apparel & Accessories
| No. | District | Volume | Value(USD) | On Year | |
| Volume | Value | ||||
| 1 | Guangdong | 7,057,169,347 | 21,253,699,924 | -12.60% | -11.20% |
| 2 | Zhejiang | 14,079,304,018 | 17,799,654,287 | -7.40% | -5.10% |
| 3 | Jiangsu | 4,655,635,529 | 11,096,786,070 | -3% | -4% |
| 4 | Fujian | 2,686,031,884 | 7,136,946,903 | -8% | -6.50% |
| 5 | Shandong | 3,159,779,757 | 6,518,401,570 | 2.30% | 0.10% |
| 6 | Shanghai | 2,187,014,645 | 5,172,794,086 | 6.60% | -8.80% |
| 7 | Jiangxi | 1,720,954,885 | 4,703,199,933 | 18.10% | 20.30% |
| 8 | Xinjiang | 956,490,091 | 1,929,770,488 | -39% | -48% |
| 9 | Beijing | 139,689,063 | 1,368,124,239 | 77.60% | 291.80% |
| 10 | Anhui | 497,539,027 | 1,127,388,885 | 4.80% | 1.90% |
| 11 | Liaoning | 210,245,199 | 835,523,053 | -14% | -18.70% |
| 12 | Henan | 140,869,508 | 610,537,759 | -37.10% | -45.60% |
| 13 | Hubei | 206,875,109 | 528,524,225 | 26.20% | 15.10% |
| 14 | Inner Mongolia | 22,550,262 | 471,024,205 | -23.30% | -10.90% |
| 15 | Heilongjiang | 100,064,883 | 436,853,643 | -71.60% | -69.40% |
| 16 | Hebei | 142,983,238 | 429,212,333 | -28.50% | -42.30% |
| 17 | Hunan | 110,437,129 | 335,666,760 | -25.20% | -43.30% |
| 18 | Tianjin | 109,894,243 | 313,436,222 | 2.70% | -6.80% |
| 19 | Jilin | 260,954,930 | 304,047,239 | 22.50% | 0% |
| 20 | Chongqing | 75,391,646 | 285,764,134 | -19.10% | -19.40% |
The top export origins of China's knit or crochet apparel & accessories were Guangdong, Zhejiang, Jiangsu, Fujian and Shandong province in 2015. Guangdong province exported USD 21,253,699,924, making the largest export origins in China. The average export price for knit or crochet apparel & accessories from Inner Mongolia was the highest (USD 20.89 per).


