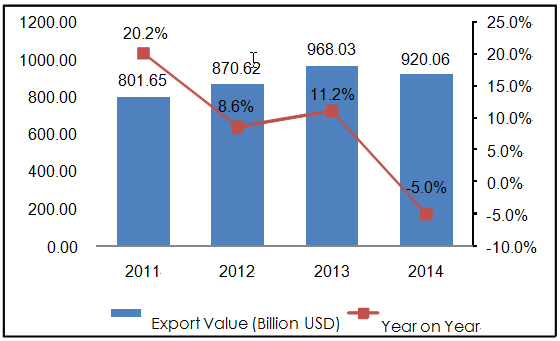
Knit & crochet exports ranked 4th in the list of the highest dollar value in Chinese global shipments during 2014. The export value was USD 92 billion and the percentage share was 3.9%. The analysis is as below.
Export Value Trend of China's knit or crochet in 2011-2014

China's knit & crochet export value had a tendency to increase from 2011 to 2013 and fell by 5% on year in 2016. And the total export value was USD 92.006 billion in 2014, 14.8% higher than 2011.
China's knit & crochet export value & volume from Jan. to Sep. in 2015
| Month | Volume | Value(USD) | Y-O-Y | |
| Volume | Value | |||
| Jan. | 3,538,804,658 | 7,281,282,469 | -15.20% | -19.40% |
| Feb. | 3,066,300,969 | 6,122,290,009 | 95.70% | 94.50% |
| Mar. | 1,550,991,375 | 3,050,791,863 | -39.70% | -40.70% |
| Apr. | 2,695,812,815 | 4,958,707,264 | -19.40% | -23.30% |
| May. | 3,201,418,505 | 6,280,963,264 | -10.9 | -11.90% |
| Jun. | 3,417,209,933 | 7,518,497,195 | -5.6 | -7.80% |
| Jul. | 3,648,217,177 | 8,509,744,114 | -12.90% | -13.80% |
| Aug. | 4,054,890,409 | 9,335,745,072 | -5.60% | -9.20% |
| Sep. | 3,824,643,411 | 8,673,672,279 | -5.70% | -9.90% |
| Total | 28,998,289,252 | 61,731,693,529 | -7.70% | -10.40% |
During this time, China's total export value of knit & crochet reached USD 61.732 billion, down 10.4% by year.
Major export countries for China's knit & crochet
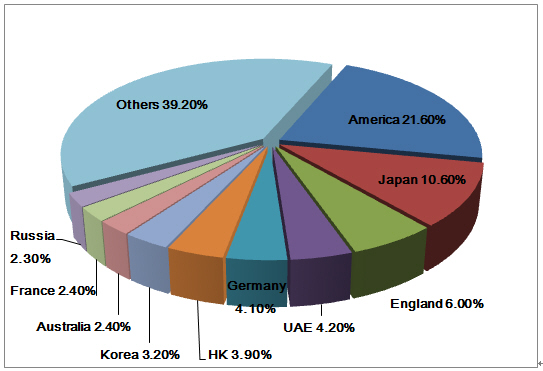
Major export market for China's knit were America, Japan, England, The United Arab Emirates, Germany, Hong Kong, Australia, France and Russia from January to September in 2015.

Export Value Percentage
America topped the list, followed by Japan and England: 21.6%, 10.6% and 5% of China total knit & crochet export value, respectively. During this time, exports to Korea grew fastest and the growth was 21.5% by year.
Distribution of China's knit & crochet export enterprises from Q1 to Q3
| No. | Region | Volume | Value(USD) | Y-O-Y | |
| Volume | Value | ||||
| 1 | Guangdong | 5,056,650,757 | 14,974,560,672 | -15.70% | -14.60% |
| 2 | Zhejiang | 10,710,453,100 | 13,506,460,472 | -6.40% | -4.10% |
| 3 | Jiangsu | 3,575,853,850 | 8,537,992,560 | -1.50% | -2.50% |
| 4 | Fujian | 2,021,665,642 | 5,518,043,887 | -9.40% | -6.90% |
| 5 | Shandong | 2,357,844,756 | 4,715,869,970 | 2.50% | -1.90% |
| 6 | Shanghai | 1,712,629,867 | 4,014,553,211 | 10.50% | -6.10% |
| 7 | Jiangxi | 1,299,230,022 | 3,589,836,364 | 16% | 16.90% |
| 8 | Xinjiang | 683,325,148 | 1,378,541,017 | -40% | -47.10% |
| 9 | Anhui | 351,990,494 | 820,032,904 | -1.30% | -2.20% |
| 10 | Liaoning | 154,521,295 | 610,902,811 | -14.90% | -22.70% |
| 11 | Henan | 105,531,342 | 440,100,551 | -40.10% | -49% |
| 12 | Inner Mongolia | 20,242,048 | 419,017,274 | 17.30% | 11.20% |
| 13 | Hubei | 148,647,148 | 377,873,956 | 25.90% | 12.50% |
| 14 | Hebei | 106,224,186 | 326,462,600 | -35.40% | -49.10% |
| 15 | Heilongjiang | 72,134,515 | 313,882,705 | -73.50% | -71.30% |
| 16 | Chongqing | 70,165,497 | 273,945,660 | -6.90% | 0.80% |
| 17 | Beijing | 59,755,227 | 270,727,748 | 1.10% | 1.80% |
| 18 | Hunan | 86,081,986 | 269,566,922 | -22.80% | -41.40% |
| 19 | Tianjin | 82,337,878 | 235,057,026 | 0.80% | -10.30% |
| 20 | Jilin | 189,174,826 | 231,764,129 | 32.20% | 4.10% |
Guangdong, Zhejiang and Jiangsu are the main regions where China's knit & crochet export enterprises located. Apart from three provinces above, others regions included Jiangxi, Hubei, Beijing and Jilin. In the list of top 20 export region, Inner Mongolia had the highest average price (20.0 USD/-) and Jilin had the lowest (1.23 USD/-)


