Distribution of China's Book-Binding Machinery Export Enterprises from Jan. to Dec. in 2015
| No. | Districts | Total | Y-o-Y | ||
| Volume(Unit) | Value(USD) | Volume | Value | ||
| 1 | Guangdong | 44,418 | 13,239,864 | -11% | 56.90% |
| 2 | Zhejiang | 97,523 | 9,775,026 | -9% | -7% |
| 3 | Shanghai | 34,807 | 4,855,350 | -22.30% | 21.90% |
| 4 | Jiangsu | 39,886 | 2,165,354 | 185% | 203% |
| 5 | Shandong | 535 | 856,332 | -74.50% | 15.60% |
| 6 | Beijing | 818 | 575,274 | 26.80% | 40.10% |
| 7 | Liaoning | 9,475 | 403,607 | 17.90% | 52.10% |
| 8 | Anhui | 583 | 334,792 | -78.70% | 46.60% |
| 9 | Fujian | 6,359 | 158,906 | 25.30% | 4.20% |
| 10 | Hubei | 9,415 | 109,820 | 9.30% | -31.50% |
From January to December, Guangdong, Zhejiang and Shanghai were the major districts where China's book-binding machinery export enterprises located. The three provinces' total export value accounted for 84.6% of China's total. Guangdong's export value accounted for 40.2% of the total, up 56.9% by year, which exceeded Zhejiang's and made Guangdong on the top of the export list.
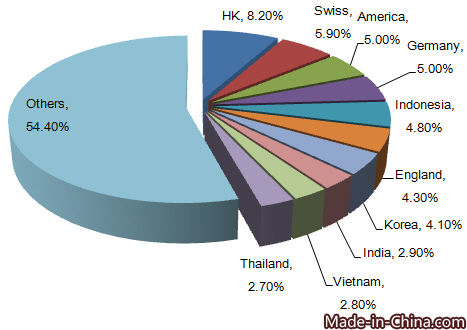
Major Countries/Regions for China's Book-Binding Machinery Export from Jan. to Dec. in 2015
| No. | Country/Region | Total | Y-o-Y | ||
| Volume(Unit) | Value(USD) | Volume | Value | ||
| 1 | Hong Kong | 4,865 | 2,704,687 | 12.50% | 23.60% |
| 2 | Swedish | 2,282 | 1,929,215 | 18916.70% | 972.40% |
| 3 | America | 12,953 | 1,645,262 | -42% | 127.20% |
| 4 | Germany | 65,197 | 1,642,843 | 405.90% | 189.30% |
| 5 | Indonesia | 1,154 | 1,566,454 | -85.40% | 50.40% |
| 6 | America | 2,651 | 1,432,164 | 43.80% | 304.30% |
| 7 | Korea | 8,699 | 1,355,403 | 49.30% | 16.50% |
| 8 | India | 2,751 | 955,553 | 35.40% | 83.20% |
| 9 | Vietnam | 10,825 | 918,146 | -21.20% | -49.40% |
| 10 | Thailand | 1,035 | 878,594 | -91.60% | 58.20% |

From Jan. to Dec. in 2015, Hong Kong, Swedish, America, Germany, Indonesia, England, Korea, India, Vietnam and Thailand were major countries for China's booking-binding machinery export. Hong Kong topped the list. The export value to Hong Kong accounted for 8.2% of China's total export value.
Major Countries/Regions in need of Booking-Binding Machinery from Jan. to Sep. in 2015
| Importing Country/Region | Import Value(USD) | Y-o-Y |
| America | 102,595,000 | 5.90% |
| Germany | 61,082,000 | -4.60% |
| China | 38,426,000 | -36.00% |
| England | 36,660,000 | 6.50% |
| France | 33,692,000 | -7.30% |
From January to September in 2015, major booking-binding machinery importing countries were America, Germany, China, England and France. As the largest importing country, America's import value was USD 103 million. From January to September in 2015, China's import value was USD 38 million and ranked third.
Major Booking-Binding Machinery Exporting Countries from Jan. to Sep. in 2015
| Exporting Country/Region | Export Value(USD) | Y-o-Y |
| Germany | 206,235,000 | -20.30% |
| Swedish | 111,566,000 | 8.80% |
| Japan | 58,045,000 | -15.70% |
| England | 41,356,000 | -0.40% |
| Italy | 40,082,000 | -3.60% |
From January to September in 2015, major booking-binding machinery exporting countries included Germany, Swedish, Japan, England and Italy. Germany was the largest export country with the export value of USD 206 million.
Among the top 5 exporting countries, Swedish's export value increased 8.8% by year in the first three quarters of 2015.


