Distribution of China Iron & Steel Tubes & Pipe (ext diam >406.4mm) Export Enterprise
| No. | Region | Export Value | Y-o-Y | ||
| Volume(kg) | Value(USD) | Volume | Value | ||
| 1 | Jiangsu | 283,011,490 | 247,490,898 | 109% | 64.60% |
| 2 | Shanghai | 239,451,614 | 195,983,374 | 105.30% | 46% |
| 3 | Guangdong | 156,228,928 | 135,555,280 | -19.10% | -18.20% |
| 4 | Hebei | 182,297,365 | 125,586,378 | 38.40% | 8.30% |
| 5 | Liaoning | 102,894,608 | 66,403,324 | -39.80% | -49.10% |
| 6 | Tianjin | 61,855,371 | 37,436,097 | -16% | -62.50% |
| 7 | Zhejiang | 32,467,663 | 28,102,793 | -34% | -43.60% |
| 8 | Shandong | 21,525,339 | 18,723,775 | 155.90% | 150.10% |
| 9 | Anhui | 15,223,585 | 15,126,702 | 20.60% | 36.50% |
| 10 | Hubei | 20,388,901 | 15,105,055 | 579.70% | 332% |
From January to October, Jiangsu province, Shanghai and Guangdong province were the main regions where China’s tubes & pipe of iron & steel export enterprise located. Jiangsu’s export value accounted for 26.7% of China’s total tubes & pipe of iron &steel export.
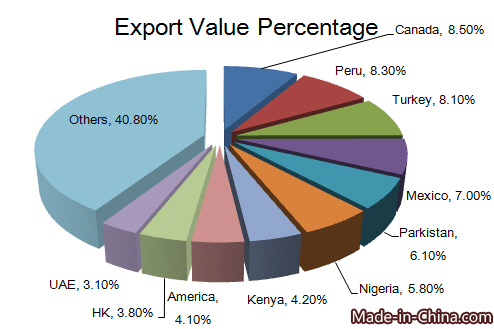
Distributions of Major Countries/Regions for China’s Tubes & Pipe of Iron & Steel Export
| No. | Country/Region | Export Value | Y-o-Y | ||
| Volume(kg) | Value(USD) | Volume | Value | ||
| 1 | Canada | 119,953,519 | 79,109,515 | -13.50% | -16.60% |
| 2 | Peru | 86,527,011 | 77,423,947 | 691.20% | 862.10% |
| 3 | Turkey | 84,596,998 | 75,344,147 | 577.80% | 644.20% |
| 4 | Mexico | 81,548,466 | 64,523,139 | 876.10% | 736.40% |
| 5 | Pakistan | 79,768,160 | 56,789,441 | 529.70% | 419.50% |
| 6 | Nigeria | 41,738,235 | 54,116,850 | 546.90% | 680.50% |
| 7 | Kenya | 44,592,985 | 38,842,769 | 799.40% | 511.70% |
| 8 | America | 52,670,823 | 38,369,640 | 18.70% | 13.20% |
| 9 | Hong Kong | 52,518,715 | 35,428,802 | -38.20% | -43.30% |
| 10 | UAE | 43,698,406 | 28,855,094 | 97.40% | 74.20% |

From January to October in 2015, Canada, Peru, Turkey, Mexico, Pakistan, Nigeria, Kenya, America, Hong Kong and UAE were major countries for China’s tubes & pipes of iron & steel export .Canada topped the list of export value, followed by Peru and Turkey.
Major countries/regions in Need of Tubes & Pipe of Iron & Steel
| Importing Country/Region | Import Value | ||
| 2012 | 2013 | 2014 | |
| Australia | 751,595,000 | 556,859,000 | 962,283,000 |
| America | 1,500,103,000 | 1,126,091,000 | 899,835,000 |
| UAE | 696,818,000 | 534,499,000 | 651,408,000 |
| Bulgaria | 2,447,000 | 8,864,000 | 650,802,000 |
| Saudi Arabia | 685,460,000 | 343,509,000 | 561,172,000 |
Unit: USD Thousand
Major tubes & pipe of iron & steel importing countries in 2014 were Australia, America, The United Arab Emirates, Bulgaria and Saudi Arabia. As the largest importing country, Australia’s import value was USD 962 million in 2014.
Major Tubes & Pipe of Iron & Steel Exporting Countries
| Exporting Country/Region | Export Value | ||
| 2012 | 2013 | 2014 | |
| Japan | 1,894,496,000 | 1,286,149,000 | 1,388,794,000 |
| China | 1,544,587,000 | 1,632,295,000 | 1,115,486,000 |
| Malaysia | 653,931,000 | 560,950,000 | 1,000,830,000 |
| Germany | 1,903,061,000 | 1,527,503,000 | 865,290,000 |
| Korea | 889,843,000 | 699,029,000 | 702,969,000 |
Unit: USD Thousand
From 2012 to 2014, main tubes & pipe of iron & steel exporting countries included Japan, China, Malaysia, Germany and Korea. Japan’s export value was USD 1389 million while


