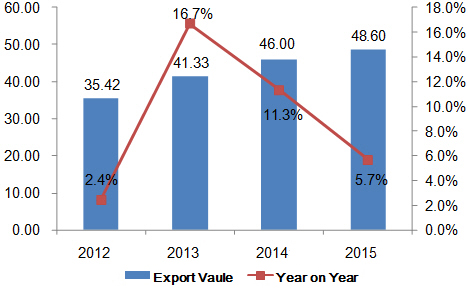
Annual Trend of China's Nonwovens & Yarns Export Value from 2012 to 2015

From 2012 to 2015, China's nonwovens & yarns export value trended up. The export value in 2015 was USD 4,860,000,000, growing 37.2% from 2012.
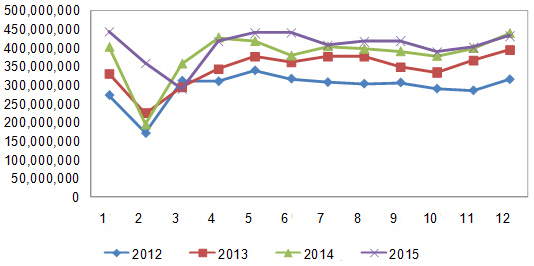
Monthly Trend of China's Nonwovens & Yarns Export Value from 2012 to 2015

China's nonwovens & yarns export value peaks were dispersal during the period from 2012 to 2015. In 2015, the export value peaked in January and hit a trough in March.
China's Nonwovens & Yarns Export Volume & Value in 2015
| Month | Volume(kg) | Value(USD) | on Year | |
| Volume | Value | |||
| January | 113,767,788 | 443,417,530 | 4.80% | 9.90% |
| February | 94,000,431 | 359,988,031 | 82.20% | 83.90% |
| March | 78,912,357 | 290,226,771 | -17% | -19.10% |
| April | 111,535,445 | 418,895,138 | 0.40% | -2.20% |
| May | 117,916,751 | 439,601,768 | 8.50% | 5% |
| June | 114,267,650 | 440,768,584 | 13.10% | 16.10% |
| July | 110,406,296 | 407,280,944 | 3.40% | 0.60% |
| August | 111,841,682 | 417,240,141 | 7.20% | 4.80% |
| September | 114,029,703 | 419,048,463 | 11.60% | 7% |
| October | 108,683,834 | 390,269,811 | 8.20% | 2.80% |
| November | 104,689,127 | 401,450,130 | 0.10% | 0.30% |
| December | 120,247,907 | 432,204,802 | 14% | -1.80% |
| Total | 1,300,298,971 | 4,860,392,113 | 8.40% | 5.70% |
China's nonwovens & yarns export value reached USD 4,860,000,000 in 2015, growing 5.7% on year.
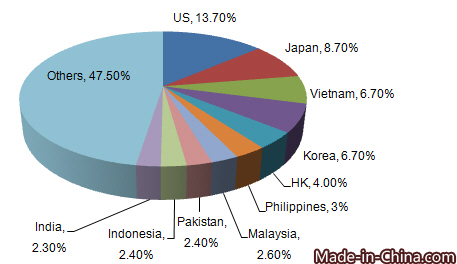
Destinations for China's Nonwovens & Yarns in 2015
| No. | Country/Region | Volume(kg) | Value(USD) | on Year | |
| Volume | Value | ||||
| 1 | United States | 196,289,716 | 663,688,021 | 21.50% | 15.80% |
| 2 | Japan | 121,218,472 | 424,057,264 | 22.30% | 12.20% |
| 3 | Vietnam | 60,839,499 | 327,395,395 | 18.70% | 1.50% |
| 4 | Korea | 99,084,473 | 324,573,761 | 14.30% | 15.30% |
| 5 | Hong Kong | 29,359,201 | 192,216,587 | -12.20% | -6.20% |
| 6 | Philippines | 26,878,184 | 147,558,501 | 40.60% | 80.50% |
| 7 | Malaysia | 29,950,456 | 127,820,929 | 6.30% | 15.30% |
| 8 | Pakistan | 22,746,975 | 117,945,542 | 25% | 35.20% |
| 9 | Indonesia | 34,188,242 | 117,191,360 | 1.90% | -2.80% |
| 10 | India | 32,968,352 | 109,968,378 | 10.70% | 10.70% |
| 11 | Australia | 28,068,418 | 97,802,142 | 26% | 10.90% |
| 12 | Germany | 27,160,847 | 95,477,419 | -5.60% | -4.30% |
| 13 | Thailand | 25,252,851 | 95,271,617 | 1.80% | -5.40% |
| 14 | United Kingdom | 27,093,613 | 92,117,879 | -4.10% | -2.90% |
| 15 | Italy | 23,616,341 | 90,738,563 | 3.80% | -1.20% |
| 16 | Mexico | 22,133,006 | 78,128,601 | 20.10% | 17.90% |
| 17 | Bangladesh | 17,207,999 | 76,347,197 | 9% | 6.20% |
| 18 | Russia | 20,716,129 | 73,775,940 | -16.80% | -19.60% |
| 19 | Taiwan | 20,443,027 | 71,215,365 | -5.80% | -2.20% |
| 20 | Canada | 20,863,528 | 66,633,053 | 11.60% | 6% |

Destinations for China's nonwovens & yarns included Korea, Vietnam, Hong Kong, Pakistan, etc in 2015. The United States was largest market for China's nonwovens & yarns export. China's nonwovens & yarns exports to the United States grew in 2015 on year and it accounted for 13.7% of China's total nonwovens & yarns export. From January to December in 2015, China's nonwovens & yarns exports to Philippines grew 11.8% on year.
China's Nonwovens & Yarns Export Origins in 2015
| No. | Districts | Volume(kg) | Value(kg) | on Year | |
| Volume | Value | ||||
| 1 | Zhejiang | 347,037,938 | 1,170,999,458 | 8.90% | 8.10% |
| 2 | Guangdong | 196,927,069 | 921,522,570 | 0.20% | -1.30% |
| 3 | Jiangsu | 224,499,638 | 807,068,190 | 9.90% | 4.70% |
| 4 | Fujian | 110,641,088 | 520,175,950 | 10.20% | 16.10% |
| 5 | Shandong | 171,000,364 | 476,546,054 | 12.10% | 5.20% |
| 6 | Shanghai | 49,857,991 | 260,446,994 | -2.10% | -4.70% |
| 7 | Anhui | 32,518,882 | 128,682,465 | 29.20% | 15.70% |
| 8 | Hebei | 42,863,740 | 118,813,718 | 4.20% | -1.10% |
| 9 | Liaoning | 31,436,280 | 100,656,543 | 14.70% | 8.40% |
| 10 | Hubei | 25,826,369 | 81,632,934 | 16.90% | 16.60% |
| 11 | Tianjin | 20,351,583 | 59,431,020 | 50% | 33% |
| 12 | Beijing | 12,626,805 | 48,920,180 | -3.20% | 0.60% |
| 13 | Jiangxi | 6,709,887 | 36,139,613 | 14.10% | 37% |
| 14 | Hunan | 2,410,067 | 22,961,343 | 42.30% | 76.20% |
| 15 | Xinjiang | 4,938,362 | 22,058,374 | -19% | -11.40% |
| 16 | Hainan | 4,265,255 | 16,068,695 | 4.90% | -5.20% |
| 17 | Henan | 3,649,768 | 13,682,382 | 20.60% | 84.70% |
| 18 | Jilin | 3,484,266 | 12,441,571 | -10.70% | -34% |
| 19 | Yunnan | 1,989,793 | 9,519,462 | 69.90% | 1.30% |
| 20 | Guangxi | 1,795,880 | 6,941,737 | -9.30% | 22.20% |
Guangdong, Zhejiang and Jiangsu were China's major nonwovens & yarns export origins. In 2015, their silk export value accounted for 59.1% of China's total. In China's top 20 export origins, Henan's nonwovens & yarns export value grew 84.7% on year. Hunan owned the highest export prices (USD 9.53 per) and Hebei owns the lowest (USD 2.77 per)


