The Export Volume and Value of Chinese Golf Cart(HS:87031011) at Jan. – Oct. 2012
| Monthly | Volume(Units) | Value(ten thousands USD) | Compared with the same period of last year ±% | |
| Volume | Value | |||
| Jan. | 41,550 | 3,301.7 | -6.5 | 18.5 |
| Feb. | 12,948 | 1,229.1 | -15.8 | 7.8 |
| Mar. | 37,295 | 2,987.8 | 6.2 | 21.1 |
| Apr. | 38,901 | 3,337.0 | -4.1 | 23.9 |
| May | 47,342 | 4,339.7 | 23.2 | 53.4 |
| Jun. | 45,445 | 4,014.8 | 5.7 | 36.8 |
| Jul. | 41,183 | 3,768.6 | 0.5 | 31.9 |
| Aug. | 38,948 | 3,155.8 | -12 | 9.6 |
| Sep. | 48,368 | 2,823.3 | -4.9 | -11.9 |
| Oct. | 48,197 | 3,003.1 | -4.5 | 4.4 |
| Total | 400,177 | 31,960.9 | -0.8 | 19.8 |
The export volume of China golf cart dropped 0.8% over the same period before and reached 400 thousands units at Jan-Oct 2012, and the export value reached $ 320 million USD in the same period, which increased 19.8%.
The Major Country/Region of China Golf Cart(HS:87031011) Export at Jan. - Oct. 2012
| No. | Country | Volume (units) | Value(ten thousands USD) |
| |
| Volume | Value | ||||
| 1 | USA | 95,291 | 6,115.0 | 32.3 | 45.8 |
| 2 | Finland | 13,218 | 3,548.0 | 243.0 | 963.1 |
| 3 | Russia | 26,426 | 2,402.6 | 71.3 | 24.5 |
| 4 | Australia | 22,120 | 1,773.2 | 7.7 | 41.1 |
| 5 | Canada | 16,401 | 1,650.5 | -6.6 | 17.6 |
| 6 | France | 9,299 | 1,492.5 | -29.6 | -12.8 |
| 7 | Germany | 20,120 | 1,461.0 | -20.0 | -21.6 |
| 8 | Sweden | 8,569 | 1,273.6 | -7.6 | -7.0 |
| 9 | Argentina | 18,686 | 1,152.6 | -42.2 | -42.0 |
| 10 | Netherlands | 32,686 | 966.6 | -16.9 | -11.4 |
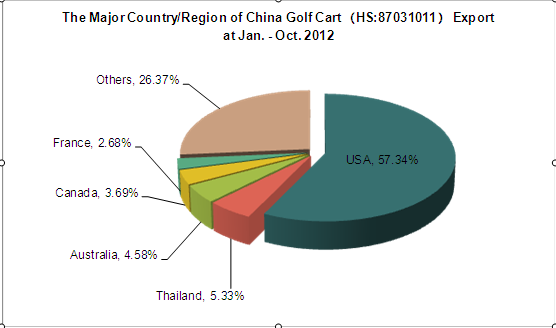
The United States is the biggest China golf cart consumption market. The export volume of China golf cart increased 32.3% and reached 95.291 thousands units at Jan-Oct 2012, and the export value reached $ $ 61,150,000 in the same period, which increased 45.8%. The ranking of top ten consumption markets made a big change compared with 2011, Finland became the second export market at 2012 which ranked 14th at 2011, also Argentina dropped as the 9th consumption market at 2012 which ranked No.2 at 2011.
The Original Place Of Delivered China Golf Cart (HS:87031011)and the Average Export Unit Cost at Jan. – Oct. 2012
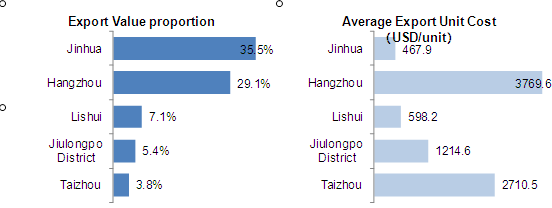
The original place of delivered china golf cart mainly focuses on Zhejiang and Chongqing, Zhejiang shared a 76.9% rate of whole China export value at Jan - Oct 2012(jinhua-35.5%, hangzhou-29.1% and Lishui 7.1%). Chongqing shared another 11.9% market (mainly focus on Jiulongpo, Ba’nan and Changshou).
The Export Analysis of Chinese Golf Clubs(HS: 950631)at Jan. – Oct. 2012
The Export Volume and Value of Chinese Golf Clubs at Jan. – Oct. 2012
| Monthly | Volume(Ten Thousands Units) | Value(Ten Thousands USD) | Compared with the same period of last year±% | |
| Volume | Value | |||
| Jan. | 375.7 | 6,765.6 | -12.9 | 0 |
| Feb. | 330.7 | 7,375.8 | 24.1 | 78.2 |
| Mar. | 423.6 | 8,400.1 | -3.5 | 11.4 |
| Apr. | 377.5 | 6,353.3 | -1.8 | 7.8 |
| May | 311.0 | 5,441.2 | 4.6 | 13.9 |
| Jun. | 267.9 | 4,282.8 | 22.5 | 39.6 |
| Jul. | 194.7 | 2,552.0 | -6.7 | -21 |
| Aug. | 175.3 | 3,019.5 | -6.9 | -1.4 |
| Sep. | 205.7 | 3,582.4 | -6.4 | -0.2 |
| Oct. | 203.5 | 3,311.6 | 6.5 | -4.5 |
| Total | 2,865.6 | 51,084.3 | 0.7 | 12.2 |
The export volume of China golf clubs increased 0.7% over the same period before and reached 2865.6 ten thousands units at Jan-Oct 2012, and the export value reached$ 510 million USD in the same period, which increased 12.2%.
The Major Country/Region of China Golf Clubs Export at Jan. – Oct. 2012
| No. | Country/Region | Volume(Ten Thousands Units) | Value(Ten Thousands USD) | Compared with the same period of last year±% | |
| Volume | Value | ||||
| 1 | USA | 1,375.6 | 17,999.0 | 5.1 | 7.9 |
| 2 | HK | 465.0 | 15,791.4 | 0.4 | 19.6 |
| 3 | Japan | 286.9 | 5,521.1 | 11.1 | 28.8 |
| 4 | UK | 291.8 | 4,697.1 | 1.8 | 16.7 |
| 5 | Canada | 133.3 | 2,339.3 | -31.4 | -18.8 |
| 6 | Korea | 56.3 | 1,307.7 | -24.2 | 2.6 |
| 7 | Australia | 60.3 | 731.2 | 15.6 | 25.5 |
| 8 | Singapore | 15.9 | 397.3 | -18.2 | 28.0 |
| 9 | South Africa | 27.7 | 355.8 | 19.0 | 33.5 |
| 10 | Germany | 37.3 | 339.2 | -1.2 | 1.6 |
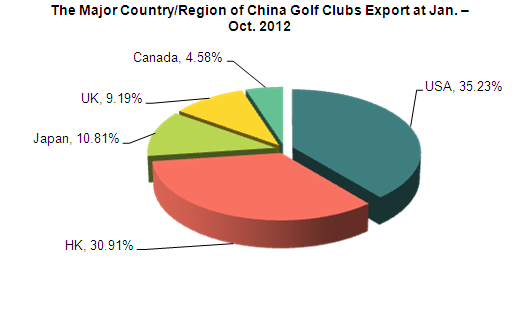
The statistics at the first ten months of 2012 shows that top 5 Chinese golf clubs consumption market are United States, HK, Japan, British and Canada. Although, the China exports is not good as forecast, but Chinese golf clubs export volume keeps increasing to Japan, Australia and South Africa in top ten consumption markets, and the corresponding increased rates are 11.1%、15.6% and 19%, also the exports value keep a 25% growth, this is a important message for Chinese suppliers.
The Original Place of Delivered China Golf Clubs and The Average Export Unit Cost At Jan. – Oct. 2012
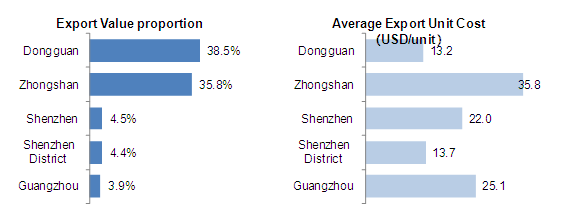
The original place of delivered china golf clubs mainly focuses on Guangdong, which shared a 91.7% rate of whole China export value at Jan - Oct 2012, and Dongguan and Zhongshan are main production base in Guangdong. By contrast, the average export unit cost from Dongguan is lower than Zhongshan, and there is a 2.7 times gap.
The Export Analysis of Chinese Golf Balls(HS: 950632) at Jan. – Oct. 2012
The Export Volume and Value of Chinese Golf Balls at Jan. – Oct. 2012
| Month | Volume(Ten Thousands Units) | Value(Ten Thousands USD) | Compared with the same period of last year±% | |
| Volume | Value | |||
| Jan. | 2,143.9 | 671.1 | -13.6 | -2.7 |
| Feb. | 1,533.2 | 452.7 | -13.4 | -19.2 |
| Mar. | 2,101.7 | 660.0 | -7.6 | -0.2 |
| Apr. | 2,417.4 | 844.8 | 13.2 | 28.2 |
| May | 2,102.2 | 748.5 | 33.7 | 50 |
| Jun. | 1,881.9 | 681.8 | 14.7 | 16.3 |
| Jul. | 1,777.7 | 701.0 | 4.2 | 25 |
| Aug. | 1,742.2 | 611.0 | 27 | 34.9 |
| Sep. | 1,952.4 | 711.6 | 51.9 | 51.6 |
| Oct. | 1,911.9 | 685.3 | 42.5 | 34 |
| Total | 19,564.6 | 6,767.9 | 11.3 | 19.8 |
The export volume of China golf balls increased 11.3% over the same period before and reached 19,600 ten thousands units at Jan-Oct 2012, and the export value reached$ 67,679,000 USD in the same period, which increased 19.8%. At first ten months of 2012, the exports volume showed a fell trend from Jan - Mar, and other 7 months showed a increased trend with different growth.
The Major Country/Region of China Golf Balls Export at Jan. – Oct. 2012
| No | Country/Region | Volume(Ten Thousands Units) | Value(en Thousands USD) | Compared with the same period of last year±% | |
| Volume | Value | ||||
| 1 | USA | 9,440.3 | 2,876.8 | 7.7 | 5.1 |
| 2 | Japan | 3,246.8 | 1,594.9 | 61.6 | 79.1 |
| 3 | Korea | 1,836.8 | 627.2 | 2.7 | 12.3 |
| 4 | UK | 1,529.5 | 458.2 | 9.2 | 20.8 |
| 5 | Canada | 1,001.0 | 279.9 | 14.4 | 12.4 |
| 6 | Holland | 418.8 | 136.7 | -0.7 | -11.6 |
| 7 | Australia | 389.6 | 125.6 | -7.3 | 12.9 |
| 8 | Mexico | 334.6 | 124.1 | 24.3 | 36.4 |
| 9 | Germany | 238.4 | 70.4 | -2.1 | 15.6 |
| 10 | HK | 182.9 | 63.1 | -42.3 | -41.5 |
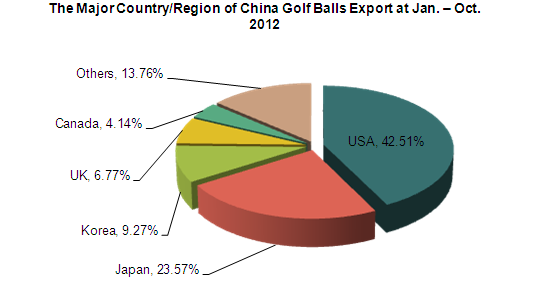
The statistics at the first ten months of 2012 shows that top 5 Chinese golf balls consumption market are United States, Japan, Korea, British and Canada. The Chinese golf balls exports keeps big increasing to Japan and Mexico in top ten consumption markets. For Japan, the export volume increased 61.6%, and the export value increased 79.1%. Also for Mexico, the export volume increased 24.3%, and the export value increased 36.4%.
The Original Place of Delivered China Golf Balls and The Average Export Unit Cost at Jan. – Oct. 2012
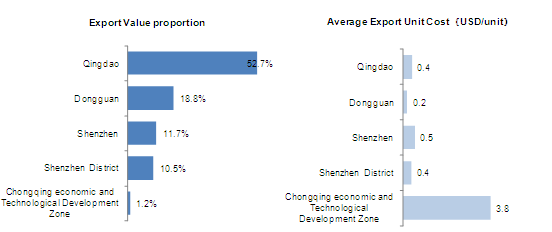
The original place of delivered china golf balls mainly focuses on Shandong and Guangdong, Shandong and Chongqing shared a 52.7% / 43% rate of whole China export value at Jan - Oct 2012. Qingdao of Shandong is the biggest original place of delivered china golf balls, Dongguan and Shenzhen are next two regions. As average export unit cost shows that Dongguan is lower than Qingdao and Shenzhen.
The Export Analysis of Chinese Other Golf Related Appliance(HS: 950639)at Jan. – Oct. 2012
| Monthly | Volume(T) | Value(Ten thousands) | the same period of last year±% | |
| Volume | Value | |||
| Jan. | 1,050.7 | 4,188.9 | -14.8 | 0.7 |
| Feb. | 894.6 | 4,434.9 | 7 | 62.4 |
| Mar. | 1,377.9 | 5,282.0 | 7.3 | 24.2 |
| Apr. | 1,581.8 | 5,856.9 | 16.8 | 40.8 |
| May | 1,431.0 | 5,030.5 | 23.5 | 43.4 |
| Jun. | 1,134.8 | 3,935.0 | 2.2 | 24.6 |
| Jul. | 1,028.6 | 4,032.5 | -3.5 | 15.2 |
| Aug. | 1,108.4 | 4,299.0 | 4.7 | 39.1 |
| Sep. | 1,077.2 | 4,376.1 | 2.1 | 46.9 |
| Oct. | 1,027.7 | 4,445.0 | -5.8 | 18.8 |
| Total | 11,712.6 | 45,880.7 | 4.1 | 30 |
The export volume of Chinese other golf related appliance increased 4.1% over the same period before and reached 1.2 ten thousands tons at Jan-Oct 2012, and the export value reached$ 0.459 billion USD in the same period, which increased 30%. At first ten months of 2012, the exports volume showed a fell trend from Jan - Mar, and other 7 months showed a increased trend with different growth.
The Major Country/Region of Chinese Other Golf Related Appliance Export at Jan. – Oct. 2012
| No. | Country/Region | Volume(T) | Value(Ten thousands) | the same period of last year±% | |
| Volume | Valu | ||||
| 1 | HK | 3,638.0 | 20,933.0 | 16.4 | 22.9 |
| 2 | USA | 4,398.9 | 12,836.4 | -2.4 | 16.4 |
| 3 | Japan | 1,197.9 | 5,206.1 | 22.9 | 51.1 |
| 4 | UK | 686.5 | 2,255.5 | -9.6 | 79.1 |
| 5 | Mexico | 260.9 | 1,465.5 | 154.3 | 185.8 |
| 6 | Taiwan | 69.0 | 705.4 | -4.0 | 14.0 |
| 7 | Canada | 345.0 | 552.5 | 79.1 | 142.6 |
| 8 | Korea | 184.8 | 346.2 | -11.2 | 22.4 |
| 9 | Australia | 203.9 | 337.1 | 15.4 | 93.3 |
| 10 | Vietnam | 69.9 | 227.4 | 167.2 | 302.2 |
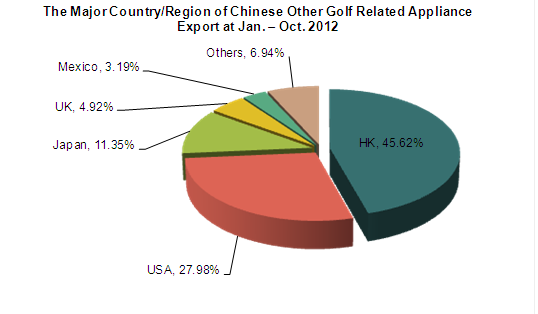
The statistics shows that top 5 Chinese other golf related appliance consumption market are HK, United States, Japan, British and Canada.
The Original Place of Delivered China Other Golf Related Appliance and The Average Export Unit Cost at Jan. – Oct. 2012
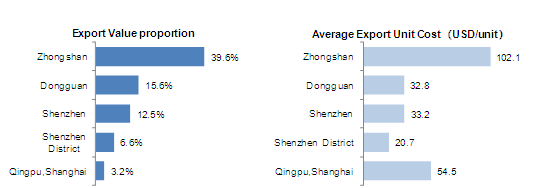
The original place of delivered china other golf related appliance mainly focuses on Guangdong, which shared a 83% rate of whole China export value at Jan - Oct 2012, and Zhongshan, Dongguan and Shenzhen are main production base in Guangdong. Shanghai is the second goods delivered place, which take 4.8% market share only. As average export unit cost shows that Zhongshan holds the biggest market share.


