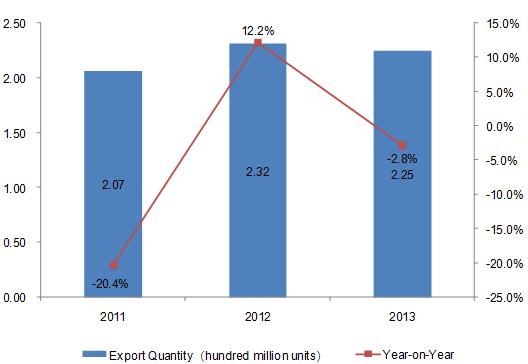
2011-2013 China Golf Ball Export Volume Trend

China export volume of golf ball showed an inverted V-shaped trend from 2011 to 2013, and the export volume for the three years amounted to 207 million (a year-on-year decrease of 20.4%), 232 million (a year-on-year increase of 12.2%) and 225 million (a year-on-year decrease of 2.8%) respectively.
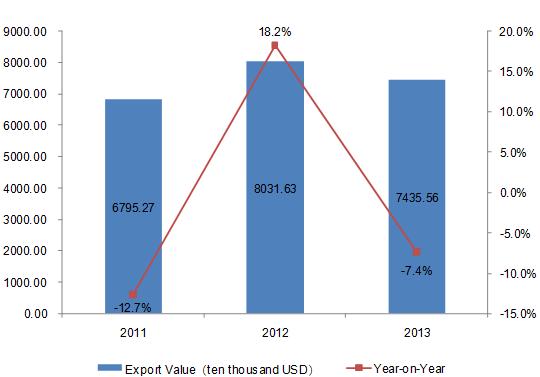
2011-2013 China Golf Ball Export Value Trend

China export value of golf ball is consistent with the trend of export volume from 2011 to 2013, and the export value for the three years amounted to 67.9527 million US dollars (a year-on-year decrease of 12.7%), 80.3163 million US dollars (a year-on-year increase of 18.2%) and 74.3556 million US dollars (a year-on-year decrease of 7.4%) respectively.
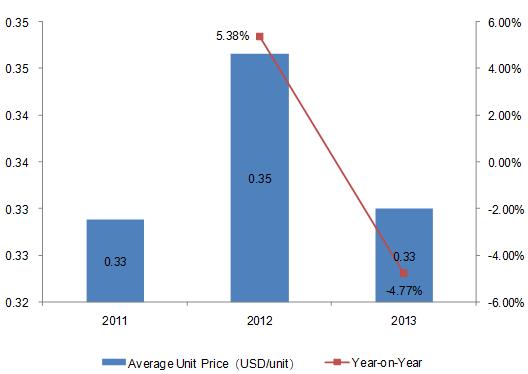
2011-2013 China Golf Ball Export Average Unit Price Trend

As can be seen from the above chart, China average export unit price of golf ball showed an inverted V-shaped trend from 2011 to 2013. The average export unit price for 2013 decreased by 4.77% compared with the same period of 2012.
2011-2013 China Golf Ball Export Market Trends Analysis
2011-2013 China Golf Ball Export Value Growth to Major Export Countries/Regions
| No. | Export Countries/Regions | Export Value (USD) | Export Value Growth Compared 2013 with 2011 | ||
| 2011 | 2012 | 2013 | |||
| 1 | USA | 32,349,704 | 34,689,505 | 34,096,080 | 5.40% |
| 2 | Japan | 11,598,807 | 18,685,529 | 17,581,620 | 51.58% |
| 3 | Republic of Korea | 6,570,691 | 7,076,930 | 5,435,481 | -17.28% |
| 4 | United Kingdom | 4,312,486 | 5,400,670 | 4,388,446 | 1.76% |
| 5 | Canada | 3,080,783 | 3,463,026 | 2,704,785 | -12.20% |
| 6 | Mexico | 1,485,985 | 1,556,102 | 1,669,202 | 12.33% |
| 7 | Netherlands | 2,047,035 | 1,843,902 | 1,431,884 | -30.05% |
| 8 | Australia | 1,278,420 | 1,464,912 | 1,050,869 | -17.80% |
| 9 | Hong Kong | 1,109,461 | 670,920 | 907,745 | -18.18% |
| 10 | Taiwan | 212,641 | 343,696 | 907,665 | 326.85% |
| 11 | Belgium | 591,385 | 455,100 | 613,355 | 3.72% |
| 12 | Germany | 703,403 | 760,894 | 468,336 | -33.42% |
| 13 | Thailand | 522,530 | 355,406 | 359,789 | -31.14% |
| 14 | Malaysia | 309,436 | 398,148 | 350,022 | 13.12% |
| 15 | France | 228,750 | 432,717 | 300,111 | 31.20% |
| 16 | Iran | / | 80,945 | 208,200 | / |
| 17 | India | 113,371 | 27,156 | 176,583 | 55.76% |
| 18 | Iraq | / | / | 159,430 | / |
| 19 | South Africa | 71,874 | 360,695 | 155,350 | 116.14% |
| 20 | Singapore | 329,811 | 400,983 | 137,725 | -58.24% |
The three largest export markets of Chinese golf ball are the United States, Japan and South Korea. China's export values to the United States, Japan and South Korea in 2013 are 34.0961 million US dollars, 17.5816 million US dollars and 54.355 million US dollars respectively. Among the twenty export markets above, the export value of China to Taiwan increased the most, an increase of 326.85% compared 2013 with 2011, followed by South Africa, an increase of 116.14%.
2011-2013 China Golf Ball Major Export Countries/Regions Market Share Trend
| No. | Export Countries/Regions | Export Value Percentage | ||
| 2011 | 2012 | 2013 | ||
| 1 | USA | 47.61% | 43.19% | 45.86% |
| 2 | Japan↑ | 17.07% | 23.26% | 23.65% |
| 3 | Republic of Korea↓ | 9.67% | 8.81% | 7.31% |
| 4 | United Kingdom | 6.35% | 6.72% | 5.90% |
| 5 | Canada↓ | 4.53% | 4.31% | 3.64% |
| 6 | Mexico | 2.19% | 1.94% | 2.24% |
| 7 | Netherlands↓ | 3.01% | 2.30% | 1.93% |
| 8 | Australia↓ | 1.88% | 1.82% | 1.41% |
| 9 | Hong Kong | 1.63% | 0.84% | 1.22% |
| 10 | Taiwan↑ | 0.31% | 0.43% | 1.22% |
| 11 | Belgium | 0.87% | 0.57% | 0.82% |
| 12 | Germany↓ | 1.04% | 0.95% | 0.63% |
| 13 | Thailand | 0.77% | 0.44% | 0.48% |
| 14 | Malaysia | 0.46% | 0.50% | 0.47% |
| 15 | France | 0.34% | 0.54% | 0.40% |
| 16 | Iran↑ | 0 | 0.10% | 0.28% |
| 17 | India | 0.17% | 0.03% | 0.24% |
| 18 | Iraq | 0 | 0 | 0.21% |
| 19 | South Africa | 0.11% | 0.45% | 0.21% |
| 20 | Singapore | 0.49% | 0.50% | 0.19% |
Note: “↑”represents that the indicators listed continued to increase from 2011 to 2013, “↓”represents that the indicators listed continued to decrease from 2011 to 2013.
Judging from the export market share trends, the market share for Japan, Taiwan and Iran continued to rise, while that for South Korea, Canada, the Netherlands, Australia and Germany continued to decline.


