| Countries/Regions | Export Quantity ( Handful ) | Export Value (US Dollar) | Year on Year (± %) | |
| Quantity | Value | |||
| USA | 483,186,104 | 75,448,980 | 14.20% | 15.70% |
| Brazil | 112,623,375 | 14,083,706 | -6.40% | 1.70% |
| Japan | 141,374,516 | 13,772,782 | 3.20% | 27.10% |
| Hong Kong | 75,367,458 | 12,028,692 | 2.30% | 9.50% |
| India | 174,703,084 | 11,518,474 | -21.40% | -19.40% |
| United Kingdom | 88,359,000 | 11,099,529 | -3.80% | 6.80% |
| Germany | 85,059,086 | 11,067,412 | 26.50% | 63.30% |
| Russian Federation | 54,438,585 | 8,054,517 | 42.40% | 51.10% |
| United Arab Emirates | 92,977,950 | 7,553,224 | 76.70% | 60.50% |
| Mexico | 51,378,248 | 7,274,046 | -8.50% | 19.60% |
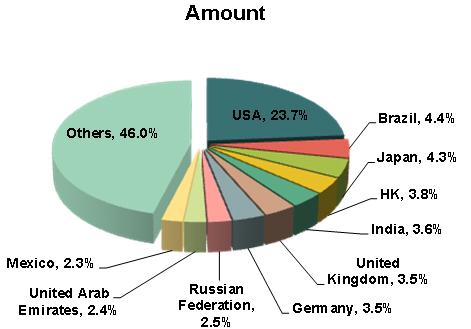
USA was the largest export market of Chinese tooth brushes, which proportion was 23.7%.
The statistics from January to August in 2012 shows that the export markets of Chinese tooth brushes were dispersed relatively. The top ten export markets of Chinese tooth brushes were as follows: USA, Brazil, Japan, Hong Kong, India, United Kingdom, Germany, Russian Federation, United Arab Emirates and Mexico, which occupied 54% of the total export values for Chinese tooth brushes in sum. As all the countries and regions mentioned above, USA was the largest export market of Chinese tooth brushes, accounted for about 23.7%. Followed by Brazil and Japan, their proportions were 4.4% and 4.3% respectively.
Germany, Russian Federation and United Arab Emirates' demands for Chinese tooth brushes grew significantly, while India's demand declined obviously.
Among the top ten export markets of Chinese tooth brushes, the export values for 9 countries and regions grew year on year. The export values for Germany, Russian Federation and United Arab Emirates increased significantly, with a rise of 63.3%, 51.1% and 60.5% year on year respectively. However, the export value for India declined 26.8% year on year and the export quantity for India dropped 21.4% year on year.


