Global Articles of Apparel & Clothing Accessories-Not Knitted or Crocheted Import Value Trend from 2010 to 2012
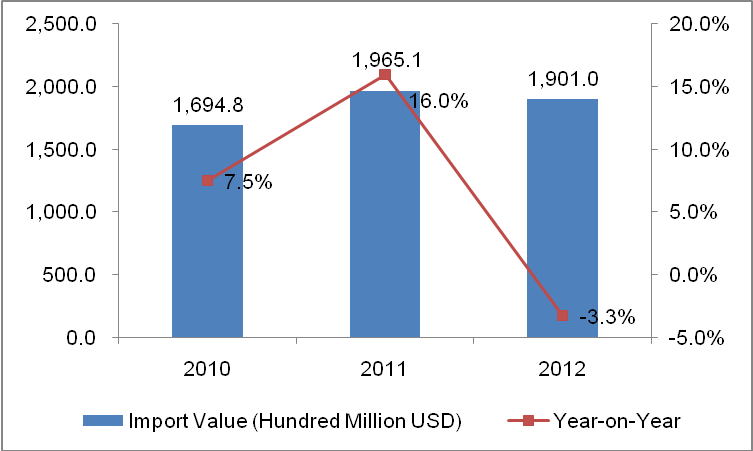
Global import value of Articles of Apparel & Clothing Accessories-Not Knitted or Crocheted showed a tendency to pour “V" from 2010 to 2012, with an increase of 16% of the import value in 2011 year on year and a decrease of 3.3% in 2012 year on year.
Global Articles of Apparel & Clothing Accessories-Not Knitted or Crocheted Main Import Country/Region Trend from 2010 to 2012
Global Articles of Apparel & Clothing Accessories-Not Knitted or Crocheted Main Import Country/Region Imports Growth from 2010 to 2012
| No. | Import Country/Region | Import Value (Hundred Million USD) | Import Value Growth Compared 2012 to 2010 | ||
|
|
| 2010 | 2011 | 2012 |
|
| 1 | USA | 356.9 | 382.4 | 380.9 | 6.7% |
| 2 | Germany | 167.0 | 197.1 | 175.7 | 5.2% |
| 3 | Japan | 126.2 | 158.9 | 164.0 | 30.0% |
| 4 | UK | 108.2 | 124.5 | 118.0 | 9.1% |
| 5 | France | 103.7 | 116.2 | 105.9 | 2.2% |
| 6 | Italy | 77.6 | 87.5 | 73.8 | -4.9% |
| 7 | Hong Kong | 69.1 | 73.5 | 70.9 | 2.6% |
| 8 | Spain | 71.1 | 81.0 | 70.7 | -0.5% |
| 9 | Netherlands | 42.5 | 54.7 | 49.1 | 15.5% |
| 10 | Canada | 36.8 | 42.4 | 42.2 | 14.8% |
USA is the world's biggest importer of Articles of Apparel & Clothing Accessories-Not Knitted or Crocheted, increased by 6.7% compared 2012 to 2010. The export value of Germany and Japan ranked the second and third respectively.
Global Articles of Apparel & Clothing Accessories-Not Knitted or Crocheted Main Import Country/Region Market Share Trends from 2010 to 2012
| No. | Import Country/Region | Import Value in Proportion | ||
|
|
| 2010 | 2011 | 2012 |
| 1 | USA | 21.06% | 19.46% | 20.04% |
| 2 | Germany | 9.85% | 10.03% | 9.24% |
| 3 | Japan↑ | 7.45% | 8.08% | 8.63% |
| 4 | UK↓ | 6.38% | 6.33% | 6.21% |
| 5 | France↓ | 6.12% | 5.91% | 5.57% |
| 6 | Italy↓ | 4.58% | 4.45% | 3.88% |
| 7 | Hong Kong↓ | 4.08% | 3.74% | 3.73% |
| 8 | Spain↓ | 4.19% | 4.12% | 3.72% |
| 9 | Netherlands | 2.51% | 2.78% | 2.58% |
| 10 | Canada | 2.17% | 2.16% | 2.22% |
Note: ↑represents indicators listed continues to increase from 2010 to 2012, ↓represents indicators listed continues to decrease from 2010 to 2012
Among the top ten major importing countries and regions, the market share of imports of Japan continued to increase from 2010 to 2012, while UK, France, Italy, Hong Kong and Spain continued to decrease.
Global Articles of Apparel & Clothing Accessories-Not Knitted or Crocheted Main Import Country/Region from Jan. to April in 2013
| No. | Import Country/Region | Import Value (Thousand USD) | Year on Year |
| 1 | USA | 12,879,902 | 3.79% |
| 2 | Germany | 5,829,806 | -4.29% |
| 3 | Japan | 5,189,259 | -2.99% |
| 4 | France | 3,841,654 | 1.44% |
| 5 | UK | 3,386,455 | -0.63% |
| 6 | Spain | 2,610,776 | 13.98% |
| 7 | Italy | 2,386,468 | -8.24% |
| 8 | Netherlands | 1,828,950 | -1.26% |
| 9 | The Russian Federation | 1,408,603 | 7.68% |
| 10 | Republic of Korea | 1,366,192 | 9.20% |
Source: UN Comtrade


