2012 Jan.-Dec. Chinese Christmas Tree Lamp Set (940530) Export Volume and Value
| Month | Quantity (Set) | Value (USD) | Year on Year(±%) | |
| Quantity | Value | |||
| Jan. | 3,529,476 | 11,439,582 | -4.8% | 15.4% |
| Feb. | 488,015,417 | 4,294,384 | 20496% | -34.5% |
| Mar. | 5,691,141 | 12,658,907 | 21.3% | 20.5% |
| Apr. | 9,308,548 | 22,162,113 | 5.4% | 0.3% |
| May | 16,105,550 | 38,534,382 | -4.9% | -13% |
| Jun. | 45,161,800 | 93,852,954 | 23.6% | 18.1% |
| Jul. | 87,709,864 | 214,439,345 | 17.3% | 6.6% |
| Aug. | 167,242,104 | 438,470,870 | 37.2% | 18.9% |
| Sep. | 109,023,604 | 307,276,877 | 5.6% | 1.9% |
| Oct. | 37,354,941 | 97,571,804 | -3.3% | -8.6% |
| Nov. | 5,135,314 | 12,523,699 | 33.3% | 3.4% |
| Dec. | 4,777,212 | 9,304,459 | 43.8% | -6.6% |
| Jan.-Dec. total | 979,054,971 | 1,262,529,376 | 133.8% | 7.6% |
The total export quantity of Chinese Christmas tree lamp sets reaches 9.79 billion sets from Jan. to Dec. in 2012, and the export value amounts to 1.26 billion US dollars. The export quantity increased by 133.8% year-on-year and the export value increased by 7.6% year-on-year.
2012 Jan.-Dec. Chinese Christmas Tree Lamp Set (940530) Major Export Countries/Regions
| No. | Countries | Quantity (Set) | Value (USD) | Year on Year(±%) | |
| Quantity | Value | ||||
| 1 | USA | 190,291,100 | 496,658,974 | 5.6% | 8.4% |
| 2 | Germany | 21,036,261 | 82,410,709 | -5.1% | 6.3% |
| 3 | UK | 16,079,605 | 75,725,686 | 14.4% | 14.8% |
| 4 | Netherland | 17,418,139 | 73,673,635 | 8% | -3.3% |
| 5 | Brazil | 68,302,853 | 70,459,573 | 245.2% | 94.9% |
| 6 | Canada | 14,356,564 | 50,270,804 | 0.3% | 4.9% |
| 7 | Mexico | 20,619,858 | 48,255,360 | -15.3% | -10.2% |
| 8 | Italy | 6,812,036 | 35,800,519 | -25.2% | -23.5% |
| 9 | Australia | 5,817,955 | 33,790,877 | 30.1% | 61.8% |
| 10 | France | 4,160,639 | 24,608,031 | -0.6% | 3.8% |
2012 Jan.-Dec. Chinese Christmas Tree Lamp Set (940530) Major Export Countries/Regions (by export value)
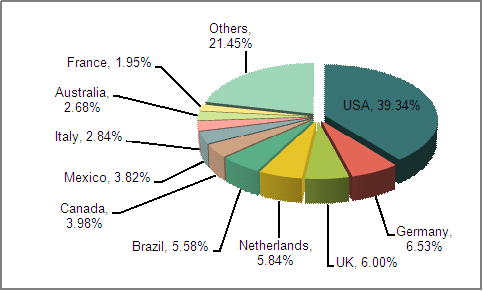
From Jan. to Dec. in 2012, among the top ten export destination countries, the export quantity of Christmas tree lamp sets to six countries increase while the other four decrease. Compared with the same period of export quantity, Brazil shows a big increase (year-on-year increase of 245.2%), and on the other hand, Italy shows a big drop (year-on-year decrease of 25.2%). Compared with the same period of export value, Brazil (year-on-year increase of 94.9%) and Australia (a year-on-year increase of 61.8%) show a big increase. It is noteworthy that Malaysia ranks from 11th to 9th, which puts Malaysia among top ten export destination countries of Christmas tree lamp sets.
2012 Jan.-Dec. Chinese Christmas Tree Lamp Set (940530) Origins of Exports
| No. | Regions | Quantity (Set) | Value (USD) | Year on Year(±%) | |
| Quantity | Value | ||||
| 1 | Zhejiang | 284,982,505 | 667,105,522 | 29.7% | 9.1% |
| 2 | Guangdong | 173,522,141 | 469,122,031 | 2% | 4.8% |
| 3 | Jiangsu | 6,031,861 | 36,618,734 | 11.7% | 16.7% |
| 4 | Jiangxi | 11,311,254 | 33,459,641 | 22.8% | 15.5% |
| 5 | Shanghai | 3,614,434 | 13,838,608 | 13% | 16.1% |
| 6 | Fujian | 2,587,105 | 11,295,378 | -13.8% | 17.2% |
| 7 | Anhui | 4,257,496 | 10,445,560 | 90.9% | -11.2% |
| 8 | Shandong | 798,573 | 9,951,136 | -68.4% | -30.2% |
| 9 | Hubei | 4,115,611 | 6,083,376 | 94.9% | 83.6% |
| 10 | Sichuan | 604,217 | 2,172,815 | 2822.2% | 811.8% |
Zhejiang, Guangdong, Jiangsu and Jiangxi are the main export sourcing destinations of Chinese Christmas tree lamp sets. From January to December in 2012, the exports value of the four provinces mentioned above make up 95.5% of the total exports value of our whole country. Among the top 10 export sourcing destinations of Chinese Christmas tree lamp sets, Sichuan Province shows the largest increase of both export volume and value, with 2822.2% year-on-year increase of export volume and 811.8% year-on-year increase of export value.
(Source: China Customs)


