China Granite, Basalt, Sandstone and Other Monumental or Building Stone Export Volume and Value, from Jan. to Dec. 2014
| Month | Volume (KG) | Value (USD) | Compared to the Same Period of 2013 | |
| Volume | Value | |||
| Jan. | 54,991,824 | 2,389,113 | -59.5% | -57.5% |
| Feb. | 47,012,636 | 1,584,383 | -15% | -29.7% |
| Mar. | 123,679,323 | 13,033,259 | 370.6% | 250.6% |
| Apr. | 169,373,476 | 7,531,394 | 98.7% | 66.4% |
| May | 116,323,188 | 7,278,348 | 32.5% | 67.8% |
| Jun. | 207,021,766 | 6,644,310 | 165.3% | 23% |
| Jul. | 151,954,952 | 5,480,076 | 169.1% | -28.5% |
| Aug. | 190,111,843 | 5,936,177 | 186% | -17.5% |
| Sep. | 212,042,297 | 6,187,933 | 306.8% | -35.8% |
| Oct. | 308,438,769 | 9,089,256 | 462.9% | 84.6% |
| Nov. | 313,328,477 | 7,388,982 | 276.3% | -59.7% |
| Dec. | 315,791,562 | 8,088,325 | 277.1% | -66.4% |
| Total of Jan. to Dec | 2,210,070,113 | 80,631,556 | 155.4% | -17.4% |
From Jan. to Dec. 2014, Chinese Granite, Basalt, Sandstone and Other Monumental or Building Stone accumulative total export volume was about 2.21 million tons; the export value was 80.63 million US dollars. The export volume increased 155.4% year-on-year (YOY), the export value declined 17.4% year-on-year (YOY).
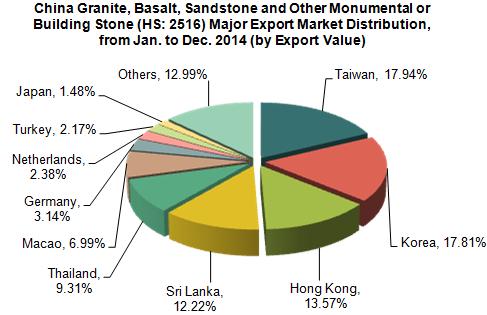
China Granite, Basalt, Sandstone and Other Monumental or Building Stone Major Export Countries/Regions Distribution, from Jan. to Dec. 2014
| No. | Country/Region | Volume (KG) | Value (USD) | Compared to the Same Period of 2013 | |
| Volume | Value | ||||
| 1 | Taiwan | 713,102,581 | 14,464,219 | 19.3% | -7.8% |
| 2 | Korea | 35,261,836 | 14,358,253 | -8.7% | 6.8% |
| 3 | Hong Kong | 1,033,375,978 | 10,942,508 | 17245.7% | 378.3% |
| 4 | Sri Lanka | 5,980,680 | 9,856,385 | 4368.5% | 4348.3% |
| 5 | Thailand | 10,031,125 | 7,509,934 | -24.3% | 190.7% |
| 6 | Macao | 264,193,550 | 5,633,695 | 23124.8% | 1.1% |
| 7 | Germany | 51,321,183 | 2,534,550 | -4.2% | -8.7% |
| 8 | Netherlands | 15,242,580 | 1,921,449 | -67.4% | 4.2% |
| 9 | Turkey | 3,073,670 | 1,747,563 | -71.3% | 100.4% |
| 10 | Japan | 14,768,139 | 1,189,849 | 21.4% | 17.8% |

Taiwan was China Granite, Basalt, Sandstone and Other Monumental or Building Stone largest export markets, from Jan. to Dec. 2014, the export value to Taiwan was 14.46 million US dollars, which declined 7.8% year-on-year (YOY) and accounted for 17.94% of the total. Followed by Korea, the market share was 17.81%.
China Granite, Basalt, Sandstone and Other Monumental or Building Stone Original Places of Exported Goods, from Jan. to Dec. 2014
| No. | Region | Volume (KG) | Value (USD) | Compared to the Same Period of 2013 | |
| Volume | Value | ||||
| 1 | Guangdong | 1,308,012,276 | 25,705,978 | 9649.6% | 499.4% |
| 2 | Liaoning | 16,429,135 | 17,210,194 | -60.2% | -66.6% |
| 3 | Shandong | 116,999,490 | 8,401,432 | -24.9% | -9.4% |
| 4 | Jiangxi | 111,717,986 | 8,363,723 | 33.7% | 32.8% |
| 5 | Fujian | 584,651,707 | 7,632,641 | 20.3% | -27.7% |
| 6 | Henan | 27,867,581 | 5,561,409 | 35.8% | 46.1% |
| 7 | Hebei | 7,707,748 | 2,188,025 | 1.4% | 116.2% |
| 8 | Chongqing | 513,350 | 1,527,838 | 62% | 213.6% |
| 9 | Sichuan | 3,579,413 | 942,027 | -42.6% | -77.6% |
| 10 | Inner Mongolia | 4,474,167 | 933,736 | -38.9% | -11.2% |
From Jan. to Dec.2014, the Chinese Granite, Basalt, Sandstone and Other Monumental or Building Stone original places of exported goods were Guangdong, Liaoning, Shandong, Shanxi and Fujian. Among the five provinces, the total export volume accounted for 96.73% of the total of Chinese export volume, the export value accounted for 83.48% of the total export value. Among the first ten Chinese Granite, Basalt, Sandstone and Other Monumental or Building Stone original places of exported goods, Guangdong's export value and volume increased obviously, the export volume increased 9649.6% year-on-year (YOY), and the export value increased 499.4% year-on-year (YOY).


