| HS Code | Product Name |
| 852190 | Nes video recording or reproducing apparatus, the following abbreviated "DVR" |
| 852580 | Television cameras, digital cameras and video camcorders, referred to as "surveillance cameras" as the following. |
2012 January-December China DVR (HS: 852190) exporting quantity and value
| Month | Quantity (Unit) | Aggregate Amount | Compared to the last year | |
| Quantity | Amount | |||
| Jan. | 10,844,685 | 444,393,799 | -20.7% | -27.7% |
| Feb. | 6,869,365 | 344,241,933 | -27.8% | -28.3% |
| Mar. | 10,633,678 | 487,085,451 | -11.9% | -16% |
| Apr. | 13,616,746 | 653,600,015 | -4.5% | 5.3% |
| May | 13,000,587 | 588,783,099 | -1.8% | -3.8% |
| Jun. | 11,008,837 | 480,680,894 | -20% | -24.5% |
| Jul. | 10,344,319 | 427,995,673 | -27.4% | -34.8% |
| Aug. | 11,501,235 | 449,053,609 | -23.5% | -32.3% |
| Sep. | 14,403,276 | 561,357,017 | -15.5% | -26.5% |
| Oct. | 15,655,131 | 653,585,433 | -8% | -15.2% |
| Nov. | 13,144,683 | 688,300,302 | -13.9% | -0.7% |
| Dec.. | 13,421,167 | 585,339,880 | 4.3% | 6.8% |
| Jan.-Dec. total | 144,443,709 | 6,364,417,105 | -14% | -16.7% |
China DVA export number is about 144 million units in January ~ December 2012. Export amounted to $ 6.36 billion. Export volume fell 14 percent, exports fell 16.7%.
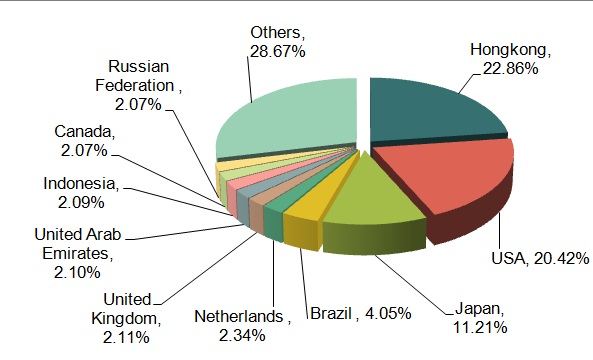
2012 January-December China DVR (HS: 852190) exporting Countries/Regions
| Number | Countries/Regions | Quantity(Unit) | Amount(USD) | Compared to the last year | |
| Quantity | Amount | ||||
| 1 | Hongkong | 25,047,886 | 1,454,869,687 | 5.9% | 35.3% |
| 2 | USA | 26,686,256 | 1,299,785,807 | -21.1% | -22.2% |
| 3 | Japan | 6,109,615 | 713,514,431 | -39% | -54.8% |
| 4 | Brazil | 8,291,058 | 257,530,550 | -9.3% | -11.7% |
| 5 | Netherland | 3,073,362 | 148,920,420 | -17.1% | -16.4% |
| 6 | British | 2,862,053 | 134,459,260 | -17.8% | -26.6% |
| 7 | The United Arab Emirates | 3,603,524 | 133,904,635 | -16.3% | -13.4% |
| 8 | Indonesia | 5,854,377 | 133,117,736 | 14.6% | 30.9% |
| 9 | Canada | 3,655,504 | 132,037,627 | -14.1% | -25.4% |
| 10 | Russia | 3,043,979 | 131,656,941 | -7% | -7% |

2012 January-December, In the top ten export countries / regions, Chinese DVR export volume decreased in which of nine countries. From the export volume, the export volume fell by a big margin was Japan (down 39%); Witness the exports amount, exports fell distinctly is Japan (down 54.8%), Hong Kong (up 35.3%) and Indonesia (up 30.9%) are two distinctly targeted export country according to the export amount.
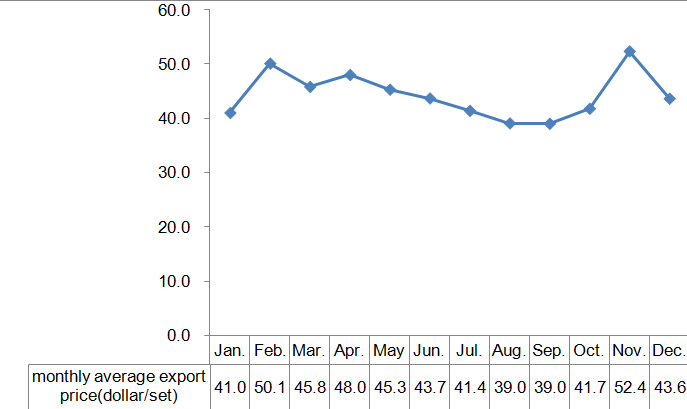
2012 January-December China DVR (HS: 852190) monthly average export price trend

With the view from the chart above, in January ~ December 2012, the average highest peak export price of DVR in November, 52.4 USD / unit, followed in February, 50.1 USD / unit, The depression period in August and September.
2012 January-December China DVR (HS: 852190) export source region.
| Number | Countries/Regions | Quantity(Unit) | Amount(USD) | Compared to the last year | |
| Quantity | Amount | ||||
| 1 | Guangdong Province | 125,882,774 | 5,011,097,061 | -15.6% | -15.2% |
| 2 | Liaoning Province | 2,089,996 | 373,804,216 | -45.3% | -45.5% |
| 3 | Shanghai | 2,928,105 | 297,316,247 | 1.7% | 3.3% |
| 4 | Tianjin | 3,836,936 | 251,570,743 | 7.2% | -3.8% |
| 5 | Zhejiang Province | 1,891,846 | 177,870,275 | 41.5% | 15.8% |
| 6 | Shandong Province | 5,028,521 | 125,101,747 | 73.5% | 26.2% |
| 7 | Jiangsu Province | 907,521 | 61,188,021 | -53.4% | -57.7% |
| 8 | Fujian Province | 698,734 | 33,903,032 | -55.5% | -49.6% |
| 9 | Jiangxi Province | 467,519 | 15,635,444 | -0.8% | -8.5% |
| 10 | Hunan Province | 56,366 | 3,489,747 | -5.2% | -32.3% |
Guangdong, Liaoning, Shanghai, Tianjin and Zhejiang are main export source region of DVR in China. The DVR export quantity of these 5 areas has accounted for 94.6%, Export amount accounted for China's total exports 96%. In top 10 DVR export source region, Shandong province is the largest increase and the export quantity rose by 73.5 percent, export amount increase by 26.2% compared to the last year.
2012 January-December China surveillance cameras (HS: 852580) export quantity and amount:
| Month | Quantity(Unit) | Amount(USD) | Compared to the last year | |
| Quantity | Amount | |||
| 1 | 52,240,355 | 659,499,869 | -18.6% | -5.8% |
| 2 | 59,667,833 | 868,321,010 | 9.8% | 33.8% |
| 3 | 72,299,132 | 1,155,246,329 | -19.6% | 7.2% |
| 4 | 59,848,704 | 1,065,276,300 | -18.6% | 17.7% |
| 5 | 65,396,584 | 971,035,173 | -17.8% | -3.1% |
| 6 | 64,075,038 | 904,590,636 | -25.1% | -7.8% |
| 7 | 62,781,585 | 910,628,376 | -27.8% | -7.4% |
| 8 | 72,435,480 | 1,150,748,048 | -24% | 5.9% |
| 9 | 83,158,335 | 1,214,226,156 | -5.3% | 3.8% |
| 10 | 80,089,270 | 1,338,333,887 | -10.3% | 17.4% |
| 11 | 88,840,372 | 1,402,566,290 | 17.2% | 47.2% |
| 12 | 78,061,230 | 1,103,109,566 | -3.1% | 18% |
| 1-12 | 838,893,918 | 12,743,581,640 | -12.9% | 10% |
January to December 2012, the total amount of export quantity of surveillance camera is about 839 million units, export amount have approached $ 12.74 billion. Export quantity has increased by 12.9%, export amount increased by 10% compared with the last year.
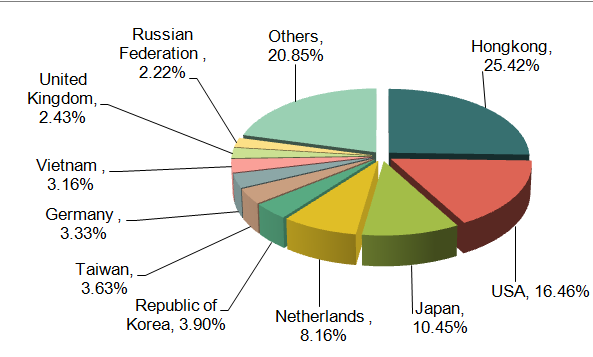
2012 January-December, China surveillance cameras (HS: 852580) main export countries / geographical distribution
| Number | Countries/Regions | Quantity(Unit) | Amount(USD) | Compared to the last year | |
| Quantity | Amount | ||||
| 1 | Hong Kong | 406,876,089 | 3,239,423,052 | 0.4% | 22.7% |
| 2 | America | 39,482,330 | 2,097,236,230 | -23.7% | -10% |
| 3 | Japan | 17,771,361 | 1,331,151,161 | 15.4% | 51.5% |
| 4 | Netherland | 18,696,371 | 1,040,045,167 | 2.4% | 28.7% |
| 5 | Korea | 75,914,756 | 496,377,168 | -29.3% | 3.9% |
| 6 | Taiwan Province | 13,010,447 | 462,446,629 | -9.1% | 238.5% |
| 7 | Germany | 7,546,508 | 424,486,560 | -22.8% | -21% |
| 8 | Vietnam | 60,351,626 | 402,648,657 | 85.3% | 112.6% |
| 9 | British | 5,650,810 | 309,479,392 | -4.5% | -3.8% |
| 10 | Russia | 5,956,626 | 283,183,332 | 9.5% | 4.7% |

2012 January-December, In the top 10 targeted export countries, the surveillance camera export quantity of these 5 areas has increased. With the export quantity vision, Vietnam have imported the large quantity which increased by 85.3% compared to the last year. With the import amount vision, Taiwan Province has listed No.1 increased by 238.5% and Vietnam also have increased by 112.6% compared to the last year.
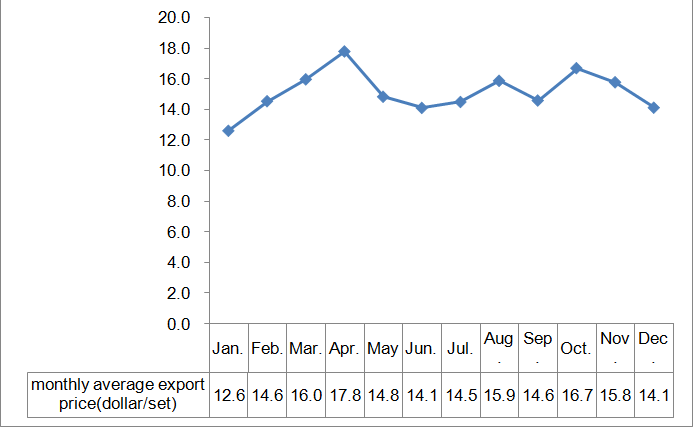
In January-December 2012, China surveillance cameras (HS: 852580): Monthly average export price trend

As you know from the chart above, Chinese average highest export quotation of surveillance camera in April: $17.8 / unit, the lowest in January $ 12.6/ unit.
In January ~ December 2012, China Surveillance camera (HS:852580) export source area:
| Number | Region | Quantity | Amount(USD) | Compared to the last year | |
| Quantity | Amount | ||||
| 1 | Guangdong Province | 508,261,471 | 5,209,823,569 | -20.4% | -14.6% |
| 2 | Jiangsu Province | 93,433,255 | 4,070,179,734 | 44.8% | 66.1% |
| 3 | Tianjin | 89,802,282 | 1,386,964,492 | -22.5% | 16.6% |
| 4 | Shanghai | 10,353,833 | 810,145,560 | 30.5% | 22.7% |
| 5 | Fujian Province | 4,953,764 | 369,749,098 | -9.8% | -20.8% |
| 6 | Jiangxi Province | 7,657,217 | 293,324,768 | 103.5% | 60.8% |
| 7 | Zhejiang Province | 20,883,675 | 238,737,203 | 32.2% | 72.6% |
| 8 | Shandong Province | 66,264,444 | 203,859,206 | 9% | 37.5% |
| 9 | Shanxi Province | 33,367,986 | 100,777,685 | -25.4% | -31.2% |
| 10 | Beijing | 498,307 | 21,838,425 | -12.9% | 3.2% |
From January to December 2012, Guangdong, Jiangsu, Tianjin and Shanghai are main surveillance camera export sources in China. These four areas of surveillance cameras export quantity accounted for 83.7% of total exports. Export amount accounting for 90.1% of total exports. In the top 10 export area of surveillance camera, Jiangxi is the largest export quantity in surveillance camera has increased by 103.5%. Zhejiang is the largest export amount has increased by 72.6% compared to the last year.
(Data Source: China Customs Website)


