Export Quantity & Value for Chinese Electric Razor from Jan. to Dec. 2013
| Month | Quantity (Piece) | Value (USD) | Year on Year | |
| Quantity | Value | |||
| Jan. | 3,311,756 | 29,240,797 | -8.1% | 11.8% |
| Feb. | 2,399,123 | 24,829,823 | -23.3% | -3.9% |
| March | 2,932,964 | 29,711,983 | -41.8% | -8.6% |
| April | 2,968,140 | 26,202,455 | -29% | -7.1% |
| May | 3,489,160 | 32,768,325 | -14.5% | 3.1% |
| June | 3,641,526 | 36,995,276 | 7.2% | 32.2% |
| July | 4,096,911 | 42,269,466 | 14.8% | 51.9% |
| August | 4,269,255 | 42,520,844 | -8.7% | 3.5% |
| Sep. | 4,732,657 | 48,210,809 | -3.2% | 9.6% |
| Oct. | 4,256,003 | 39,034,533 | -4% | -6.9% |
| Nov. | 4,278,069 | 33,844,035 | 31.3% | 15.1% |
| Dec. | 4,552,500 | 34,730,339 | 25.2% | 0.1% |
| Total from Jan. to Dec. | 44,928,064 | 420,358,685 | -6.2% | 7.4% |
The total export quantity for Chinese electric razor from Jan. to Dec. 2013 achieved 44.9281 million pieces, and declined 6.2% year on year. The total export value reached 420 million USD, and increased 7.4% year on year.
Major Countries/Regions for Chinese Electric Razor Export from Jan. to Dec. 2013
| No. | Countries/Regions | Quantity (Piece) | Value (USD) | Year on Year | |
| Quantity | Value | ||||
| 1 | USA | 12,962,938 | 129,654,185 | -9.8% | 16% |
| 2 | Japan | 8,210,714 | 83,703,589 | -23.5% | 0.2% |
| 3 | Germany | 4,408,439 | 58,985,327 | -3.7% | 10% |
| 4 | United Kingdom | 1,872,339 | 16,693,918 | 6.3% | 34.4% |
| 5 | South Korea | 1,004,142 | 13,216,855 | 18.3% | 13.9% |
| 6 | Australia | 926,301 | 11,001,235 | -22.3% | 18.2% |
| 7 | Czech Republic | 1,163,156 | 10,858,483 | 14.7% | 21.9% |
| 8 | Hong Kong | 900,205 | 9,209,650 | -65.4% | -66.5% |
| 9 | Russian Federation | 698,269 | 7,851,818 | -12.4% | -1.6% |
| 10 | Belgium | 760,492 | 7,014,724 | 61% | 103.3% |
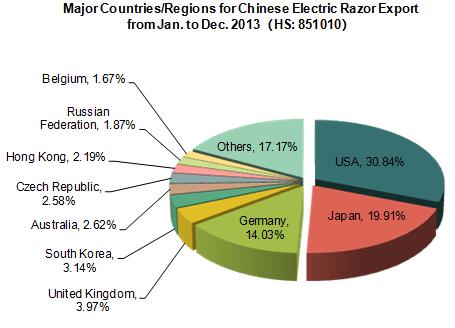
USA ranked first for Chinese electric razor export. The total export value to USA for Chinese electric razor from Jan. to Dec. 2013 was about 130 million USD, increased 16% year on year, and occupied 30.84% of all. Followed by Japan, and occupied 19.91%.
Both the export quantity & value to Belgium increased significantly among the top 10 countries/regions from Jan. to Dec. in 2013, which were 61% and 103.3% year on year respectively.
Major Cities/Provinces for Chinese Electric Razor Export from Jan. to Dec. 2013
| No. | Cities/Provinces | Quantity (Piece) | Value (USD) | Year on Year | |
| Quantity | Value | ||||
| 1 | Guangdong | 23,537,672 | 274,387,619 | -21.6% | 3.4% |
| 2 | Shanghai | 6,204,223 | 91,588,001 | 6.8% | 11.5% |
| 3 | Zhejiang | 14,427,769 | 51,122,550 | 22.5% | 19.6% |
| 4 | Jilin | 400,915 | 1,257,020 | 171.3% | 196.4% |
| 5 | Jiangsu | 67,697 | 599,216 | 0 | 0 |
| 6 | Xinjiang | 99,240 | 537,600 | 2656.7% | 9310.1% |
| 7 | Yunnan | 88,028 | 399,478 | -13.5% | -7.9% |
| 8 | Tibet | 34,390 | 212,947 | 94.6% | 124.6% |
| 9 | Liaoning | 46,628 | 138,544 | 418.1% | 468% |
| 10 | Anhui | 17,784 | 83,945 | 457.1% | 305.7% |
The major cities/provinces for Chinese electric razor export were Guangdong, Shanghai and Zhejiang, which together occupied 98.31% and 99.22% of the total export quantity & value from Jan. to Dec. 2013 respectively.
Both the export quantity & value of Xinjiang increased significantly among the top 10 cities/provinces for Chinese electric razor, which were 2656.7% and 9310.1% year on year respectively.


