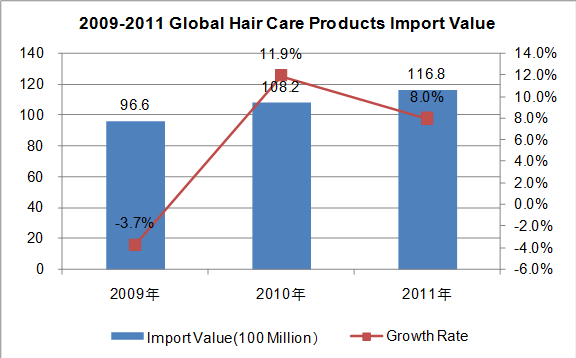
2009-2011 Global Hair Care Products Import Value

From 2009 to 2011, Global hair care products import value grew year by year. The import value achieved 11.68 billion USD in 2011, a rise of 8% year on year. The growth rate was slower, with a drop of 3.9% compared to 2010.
Major Importers for Global Hair Care Products in the first half of 2012
| No. | Countries/Regions | Import Value In the First Half of 2012 | Year on Year (± %) |
| (USD ten thousand) | |||
| 1 | USA | 446,164 | 3.97% |
| 2 | Japan | 371,629 | 40.42% |
| 3 | Untied Kingdom | 295,307 | -0.87% |
| 4 | Canada | 271,690 | 7.76% |
| 5 | Germany | 246,665 | 2.72% |
| 6 | France | 211,482 | 4.37% |
| 7 | Spain | 175,771 | 17.85% |
| 8 | Poland | 137,921 | -9.96% |
| 9 | Italy | 147,126 | -9.22% |
| 10 | Belgium | 117,428 | -5.99% |
Among the major importers for Global hair care products in the first half of 2012, Europe and America and other developed areas’ demands were higher, in which the import value for USA, Japan, Untied Kingdom, Canada and Germany were higher significantly than other countries and areas. According to the growth of import value year on year, the ten countries/areas mentioned above, the import value for Japan grew sharply, a rise of 40.42% year on year compared to 2011. Followed by Spain, it was up 17.85% year on year. However, the import value for United Kingdom, Poland, Italy and Belgium were all declined year on year.


