| HS Code | Product Name |
| 9506 | General physical exercise, gymnastics, athletics and other sports (including table tennis) or outdoor games, supplies and equipments named as others in this chapter; swimming pool or wading pool, hereinafter referred to as "Sporting Goods". |
Chinese Sporting Goods(HS: 9506) Export volume and value from Jan. to Apr. in 2013
| Month | Volume(-) | Value(USD) | Year on Year | |
| Volume | Value | |||
| January | 17,765,111 | 121,112,723 | -79.2% | 0.2% |
| February | 14,559,255 | 98,149,343 | -54.6% | 52.9% |
| March | 14,137,478 | 103,792,771 | -78% | -8.3% |
| April | 17,322,188 | 134,962,277 | -73.8% | 11.3% |
| Total | 1,304,759,403 | 3,332,363,395 | -3% | 2% |
Chinese sports goods exports amounted to $ 3.332 billion from Jan. to Apr. in 2013, with an increase of 2% year on year.
Major Export Countries / Regions for Chinese Sporting Goods((HS: 9506) from Jan. to Apr. in 2013
| No. | Country | Volume(-) | Value(USD) | Year on Year | |
| Volume | Value | ||||
| 1 | USA | 483,510,077 | 1,150,053,816 | -15.8% | -3.4% |
| 2 | Hong Kong | 22,273,462 | 225,981,414 | 0.4% | 2.9% |
| 3 | Germany | 68,953,997 | 171,383,316 | -11.7% | -10.1% |
| 4 | Japan | 53,464,855 | 156,149,110 | -2.2% | 1.1% |
| 5 | United Kingdom | 51,045,604 | 131,371,343 | -5.8% | -17.6% |
| 6 | Canada | 35,016,501 | 119,971,657 | -8.7% | -2.5% |
| 7 | France | 32,461,033 | 116,220,052 | -9.6% | -14.2% |
| 8 | Netherlands | 28,080,804 | 109,290,480 | -27.4% | 1.6% |
| 9 | Russian Federation | 27,805,063 | 76,212,530 | 34.7% | 17.7% |
| 10 | Australia | 29,621,468 | 59,491,689 | 27.7% | -1.6% |
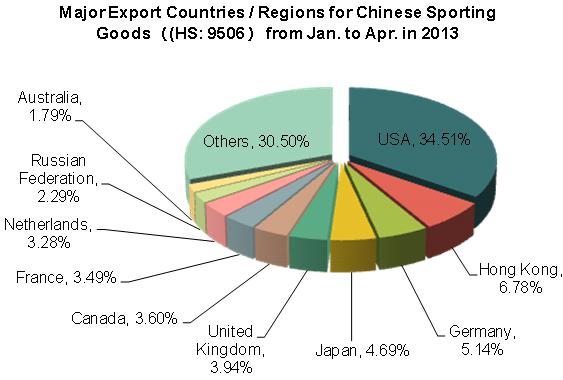
Among the top ten export destination countries / regions, the Russian Federation shows a large increase in export volume (increased by 34.7%); and also in export value (increased by17.7%) from Jan. to Apr. in 2013.
Export Source for Chinese Sporting Goods((HS: 9506)from Jan. to Apr. in 2013
| No. | Region | Volume(-) | Value(USD) | Year on Year | |
| Volume | Value | ||||
| 1 | Guangdong | 311,991,582 | 1,322,031,648 | -2% | -0.7% |
| 2 | Fujian | 127,760,260 | 556,728,106 | -0.2% | 3% |
| 3 | Zhejiang | 296,907,547 | 485,505,735 | 8.7% | 6.5% |
| 4 | Jiangsu | 179,035,162 | 316,048,583 | 6.7% | 1.3% |
| 5 | Shanghai | 102,585,922 | 244,548,774 | -3.9% | -13% |
| 6 | Shandong | 181,831,954 | 128,449,076 | -29.7% | 1.5% |
| 7 | Jiangxi | 11,054,084 | 48,659,141 | 2% | 22.3% |
| 8 | Tianjin | 20,051,470 | 47,664,789 | -6.8% | -5.3% |
| 9 | Xinjiang Uygur Autonomous Region | 5,719,294 | 35,411,201 | 239.9% | 368.2% |
| 10 | Anhui | 22,034,159 | 30,000,466 | 37.5% | 130.9% |
Guangdong, Fujian, Zhejiang, Jiangsu, Shanghai and Shandong are our main export sources for sporting goods. Sporting Goods exports together accounted for 91.98% of total exports, export value of the products together accounted for 91.63% of total value from the six above provinces / cities from Jan. to Apr. in 2013. Among the top 10 export sources, the largest increase of export volume is in Xinjiang Uygur Autonomous Region, increased by 239.9% year on year; the largest increase of export value is also in Xinjiang Uygur Autonomous Region, increased by 368.2% year on year; followed by Anhui with an increase of 130.9% year on year.
(Source: China Customs network)


