China Exports Information (Including Volume, Value And Country/Reagion) of Machinetools (Including Machines for Nailing, Stapling, Glueing or Otherwise Assembling) for Working Wood, Cork, Bone, Hard Rubber, Hard Plastics or Similar Hard Materials (HS:8456)from Jan. to Jun. of 2013 (Ranked by Export Value)
| No. | Country/Region | from Jan. to Jun. Total | Compared with the same period of last year | ||
| Volum(Unit) | Value(USD) | Volume | Value | ||
| 1 | USA | 17,451 | 29,049,378 | 1.4% | -12.4% |
| 2 | Korea | 887 | 19,801,274 | 5.6% | 51.5% |
| 3 | HK | 1,423 | 15,023,719 | -40.2% | -19.0% |
| 4 | Veitnam | 1,430 | 12,409,885 | 28.6% | 51.6% |
| 5 | Brazil | 3,792 | 11,766,493 | 139.7% | 57.9% |
| 6 | India | 2,094 | 11,357,341 | -16.6% | -0.9% |
| 7 | Germany | 2,035 | 11,208,551 | -37.2% | 104.4% |
| 8 | Japan | 1,893 | 10,888,029 | -4.3% | -14.6% |
| 9 | Switzerland | 214 | 9,631,306 | 14.4% | 28.5% |
| 10 | Thailand | 2,795 | 7,794,772 | -16.7% | -28.5% |
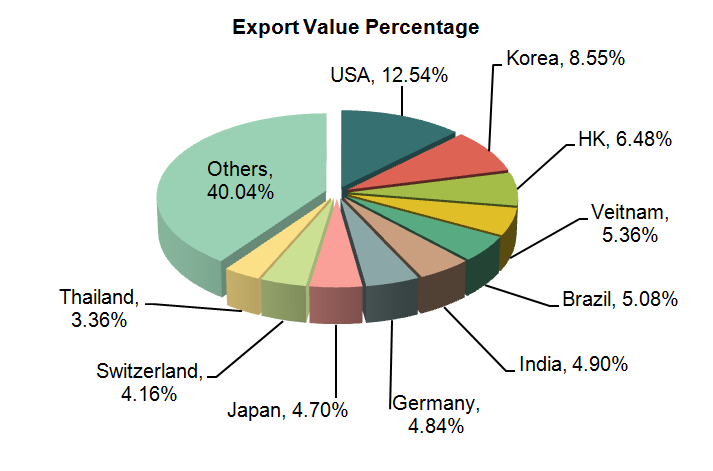
Accodring to export data from Jan. to Jun. of 2013, China machine tools (Machinetools (including machines for nailing,stapling,glueing or otherwise assembling) for working wood,cork,bone,hard rubber,hard plastics or similar hard materials) export value reached $ 232 million, which increased 5.3% as before. The mainly export countries include USA, Korea, HK, Veitnam, Brazil, India, Germany, Japan, Switzerland and Thialand. As the biggest consumption market, export value to USA took 12.54% of whole value. Germany took the fastest growth for importing China machine tools at the first half of 2013, and reached 104.4%.
China Exports Information (Including Volume, Value and Country/Reagion) of Machining Centres, Unit Construction Machines (Single Station) and Multistation Transfer Machines, for Working Metal (HS:8457) from Jan. to Jun. of 2013 (Ranked by Export Value)
| No. | Country/Region | from Jan. to Jun. total | Compared with the same period of last year | ||
| Volume(Unit) | Value(usd) | Volume | alue | ||
| 1 | HK | 230 | 7,948,882 | 666.7% | 273.0% |
| 2 | USA | 600,226 | 6,581,796 | 199975.3% | -31.9% |
| 3 | Japan | 95 | 5,996,608 | -29.6% | 14.9% |
| 4 | India | 247 | 4,741,079 | 59.4% | -9.9% |
| 5 | Germany | 174 | 4,613,306 | 11.5% | -19.2% |
| 6 | Russia | 280 | 3,634,907 | 169.2% | -28.4% |
| 7 | Mexico | 98 | 3,266,466 | 15.3% | 211.9% |
| 8 | Turkey | 65 | 2,435,156 | 182.6% | 226.7% |
| 9 | Myanmar | 11 | 2,088,440 | 37.5% | -29.7% |
| 10 | Indonesia | 78 | 1,985,030 | 36.8% | -0.6% |
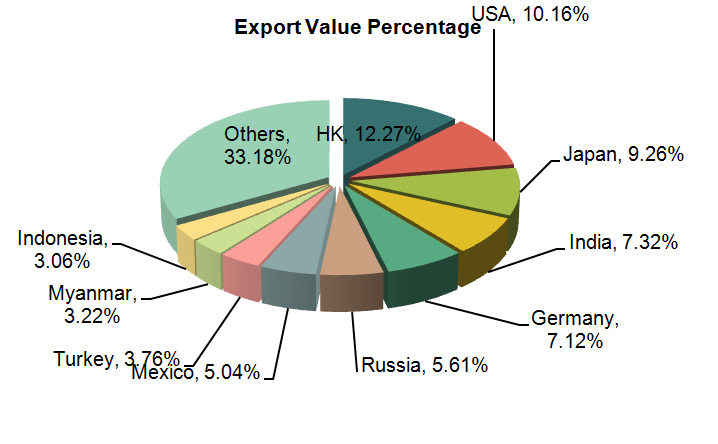
Accodring to export data from Jan. to Jun. of 2013, China machine tools (Machining centres,unit construction machines (single station) and multistation transfer machines,for working metal) export value reached $ 65 million, which increased 4.2% as before. The mainly export countries include HK, USA, Japan, India, Germany, Russia, Turkey, Mexico, Myanmar and Indonesia. As the biggest consumption market, export value to HK took 12.27% of whole value. At top 10 export markets, The growth rate of export value to HK, Mexico and Turkey is over 200% at the first half of 2013
China Exports Information (Including Volume, Value and Country/Reagion) of Lathes (Including Turning Centres) for Removing Metal (HS:8458) from Jan. to Jun. of 2013 (Ranked by Export Value)
| No. | Country/Region | from Jan. to Jun. Total | Compared with the same period of last year | ||
| Volume(Unit) | Value(USD) | Volume | Value | ||
| 1 | Japn | 1,643 | 37,232,254 | -13.9% | -6.0% |
| 2 | USA | 7,097 | 19,185,749 | 0.7% | 7.1% |
| 3 | Germany | 3,128 | 15,145,219 | -22.2% | -17.8% |
| 4 | Indonesia | 1,663 | 13,173,677 | -16.9% | 9.7% |
| 5 | Russia | 3,226 | 11,526,436 | 23.5% | 2.5% |
| 6 | Thialand | 768 | 11,150,208 | 17.3% | -9.0% |
| 7 | Malasia | 683 | 10,645,875 | 81.2% | 88.6% |
| 8 | India | 542 | 7,180,571 | 3.8% | -29.4% |
| 9 | Korea | 479 | 6,741,230 | -8.4% | -3.3% |
| 10 | Netherland | 499 | 6,456,441 | -46.0% | -58.7% |
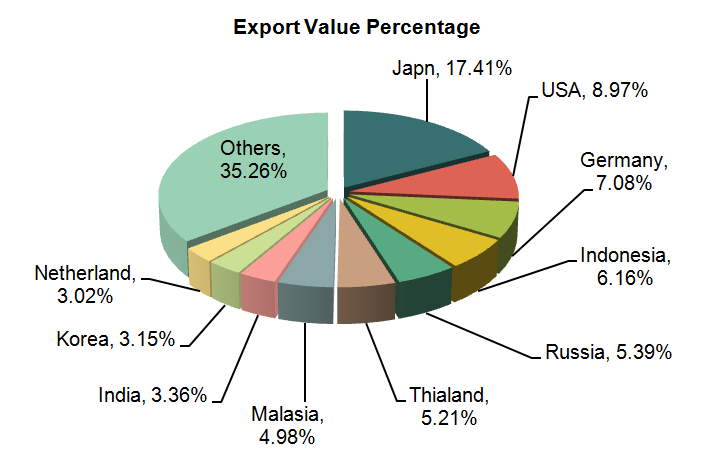
Accodring to export data from Jan. to Jun. of 2013, China machine tools (Lathes (including turning centres) for removing metal) export value reached $ 214 million, which dropped 17.8% as before. The mainly export countries include Japan, USA, Germany, Indoneisa, Russia, Thialand, Malaysia,India, Korea and Netherland. As the biggest consumption market, export value to Japan took 17.41% of whole value at the first half of 2013
China Exports Information (Including Volume, Value And Country/Reagion) of Machinetools (Including Waytype Unit Head Machines) for Drilling, Boring, Milling, Threading or Tapping by Removing Metal, Other than Lathes (Including Turning Centres) of Heading No.8458 (HS:8459) from Jan. to Jun. of 2013 (Ranked by Export Value)
| No. | Country/Region | from Jan. to Jun. total | Compared with the same periof of last year | ||
| Volume(Unit) | Value(USD) | Volume | Value | ||
| 1 | USA | 126,352 | 18,105,310 | 10.2% | 8.2% |
| 2 | Germany | 37,822 | 10,173,206 | -10.8% | -19.1% |
| 3 | Indonesia | 31,862 | 6,830,043 | 15.0% | -4.2% |
| 4 | Russia | 19,906 | 6,629,162 | -11.9% | -19.8% |
| 5 | Thailand | 11,756 | 5,769,491 | -7.3% | 56.0% |
| 6 | Brazil | 41,091 | 5,768,077 | 81.0% | -5.5% |
| 7 | India | 2,246 | 4,755,920 | -46.6% | -35.6% |
| 8 | Taiwan | 1,980 | 3,947,601 | 36.3% | 380.2% |
| 9 | HK | 914 | 3,907,155 | 48.4% | 174.0% |
| 10 | Turkey | 4,983 | 3,483,776 | -6.4% | -17.5% |
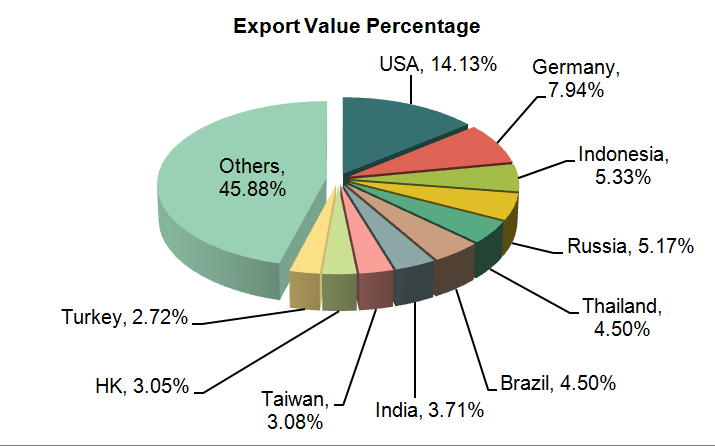
Accodring to export data from Jan. to Jun. of 2013, China machine tools (Machinetools (including waytype unit head machines) for drilling,boring,milling,threading or tapping by removing metal,other than lathes (including turning centres) of heading No.8458) export value reached $ 128 million, which dropped 3.6% as before. The mainly export countries include USA, Germany, Indonesia, Russia, Thailand, Brazil, India, Taiwan, HK andTurkey. As the biggest consumption market, export value to USA took 14.13% of whole value. At top 10 export markets, the growth rate of export value to HK and Taiwan is over 174% and 380.2% at the first half of 2013.
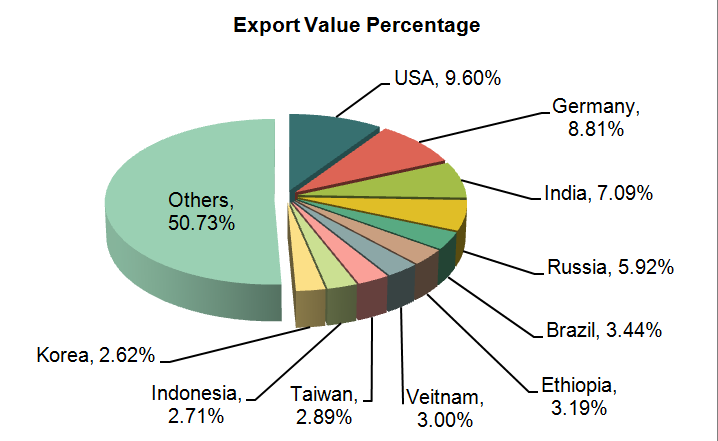
China Exports Information (Including Volume, Value and Country/Reagion) of Machinetools for Deburring,Sharpening,Grinding,Honing,Lapping,Polishing or Otherwise Finishing Metal or Cermets by Means of Grinding Stones,Abrasives or Polishing Products,Other than Gear Cutting,Gear Grinding or Gear Finishing Machines of Heading 8461 (HS:8460) from Jan. to Jun. of 2013 (Ranked by Export Value)
| No. | Country/Region | from Jan. to Jun. total | Compared with the same period of last year | ||
| Volume(unit) | Value(USD) | Volume | Value | ||
| 1 | USA | 262,192 | 12,479,020 | -19.8% | -15.7% |
| 2 | Germany | 135,315 | 11,458,600 | -49.0% | -1.3% |
| 3 | India | 11,664 | 9,219,408 | -35.8% | -34.9% |
| 4 | Russia | 255,546 | 7,699,026 | 48.1% | -3.7% |
| 5 | Brazil | 145,920 | 4,469,065 | 8.0% | 1.8% |
| 6 | Ethiopia | 76 | 4,142,666 | -96.5% | 5696.5% |
| 7 | Veitnam | 20,103 | 3,900,426 | -4.2% | 1.0% |
| 8 | Taiwan | 3,521 | 3,754,690 | -26.8% | 15.2% |
| 9 | Indonesia | 24,959 | 3,521,629 | 9.3% | 40.6% |
| 10 | Korea | 12,019 | 3,406,835 | -12.3% | -23.2% |
Accodring to export data from Jan. to Jun. of 2013, China machine tools (Machinetools for deburring,sharpening,grinding,honing,lapping,polishing or otherwise finishing metal or cermets by means of grinding stones,abrasives or polishing products,other than gear cutting,gear grinding or gear finishing machines of heading 8461) export value reached $ 130 million, which increasd 2.6% as before. The mainly export countries include USA, Germany, India, Russia, Brazil, Ethiopia, Veitnam, Taiwan, Indonesia and Korea. As the biggest consumption market, USA took 17.41% of whole export value at the first half of 2013.
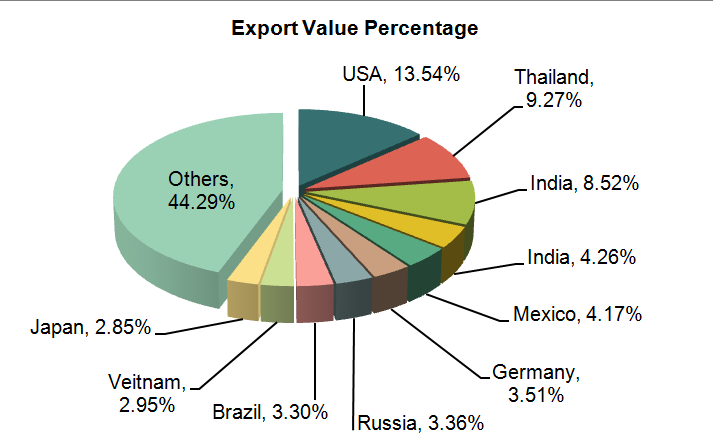
China Exports Information (Including Volume, Value and Country/Reagion) of Machinetools for Planing,Shaping,Slotting,Broaching,Gear Cutting,Gear Grinding or Gear Finishing,Sawing,Cuttingoff and Other Machinetools Working by Removing Metal or Cermets,Not Elsewhere Specified or Included (HS:8461) from Jan. to Jun. of 2013 (Ranked by Export Value)
| No. | Country/Region | from Jan. to Jun. total | Compared with the same period of last year | ||
| Volume(Unit) | Value(USD) | Volume | Value | ||
| 1 | USA | 155,006 | 14,473,899 | -31.2% | -30.9% |
| 2 | Thailand | 127,565 | 9,908,676 | 9.3% | 14.9% |
| 3 | India | 94,068 | 9,107,973 | -3.9% | 1.4% |
| 4 | India | 37,568 | 4,555,538 | 43.8% | 27.3% |
| 5 | Mexico | 51,119 | 4,458,426 | 47.4% | 27.7% |
| 6 | Germany | 31,940 | 3,748,252 | -30.4% | -31.0% |
| 7 | Russia | 19,391 | 3,590,677 | -23.1% | -25.8% |
| 8 | Brazil | 23,742 | 3,525,327 | -6.4% | -14.2% |
| 9 | Veitnam | 40,169 | 3,157,639 | 40.0% | 14.2% |
| 10 | Japan | 27,151 | 3,045,100 | 16.6% | -40.9% |
Accodring to export data from Jan. to Jun. of 2013, China machine tools (Machinetools for planing,shaping,slotting,broaching,gear cutting,gear grinding or gear finishing,sawing,cuttingoff and other machinetools working by removing metal or cermets,not elsewhere specified or included) export value reached $ 107 million, which dropped 4.7% as before. The mainly export countries include USA, Thailand, India, Indonesia, Mexico, Russia, Brazil, Veitnam and Japan. As the biggest consumption market, USA took 13.54% of whole China export value at the first half of 2013.
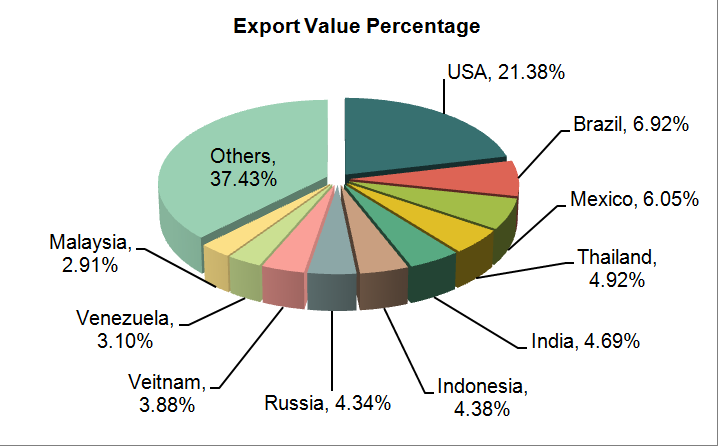
China Exports Information (Including Volume, Value and Country/Reagion) of Machine Tools (Including Presses) for Working Metal by Forging, Hammering or Die-Stamping; Machine-Machinetools (Including Presses) for Working Metal by Forging, Hammering or Diestamping;Machinetools (Including Presses) for Working Metal by Bending, Folding, Straightening, Flattening, Shearing, Punching or Notching; Presses for Working Metal or Metal (HS:8462) from Jan. to Jun. of 2013 (Ranked by Export Value)
| No. | Country/Region | from Jan. to Jun. total | Compared with the same period of last year | ||
| Voulme(unit) | Value(USD) | Volume | Value | ||
| 1 | USA | 65,468 | 88,447,551 | 41.4% | 123.4% |
| 2 | Brazil | 1,232 | 28,620,245 | -28.5% | 90.7% |
| 3 | Mexico | 4,325 | 25,015,443 | -2.0% | 626.7% |
| 4 | Thailand | 1,788 | 20,358,694 | 24.0% | -0.5% |
| 5 | India | 1,703 | 19,394,257 | 37.3% | -61.5% |
| 6 | Indonesia | 3,486 | 18,137,272 | -8.9% | 23.8% |
| 7 | Russia | 13,238 | 17,956,403 | -13.5% | 24.9% |
| 8 | Veitnam | 668 | 16,055,706 | 19.1% | 163.1% |
| 9 | Venezuela | 632 | 12,831,916 | 297.5% | 692.3% |
| 10 | Malaysia | 2,054 | 12,052,467 | 23.1% | 1.8% |
Accodring to export data from Jan. to Jun. of 2013, China machine tools (Machine Tools (Including Presses) For Working Metal By Forging, Hammering Or Die-Stamping; Machine-Machinetools (including presses) for working metal by forging, hammering or diestamping; machinetools (including presses) for working metal by bending, folding, straightening, flattening, shearing, punching or notching; presses for working metal or metal) export value reached $ 414 million, which increased 23.2% as before. The mainly export countries include USA, Brazil, Mexico, Thailand, India, Indonesia, Russia, Veitnam, Venezuela and Malaysia. As the biggest consumption market, USA took 21.38% of China whole value. At top 10 export markets, The growth rate of export value to USA, Mexico, Veitnam and Venezuala is over 100%, which reached 123.4%、626.7%、163.1% and 692.3% at the first half of 2013.
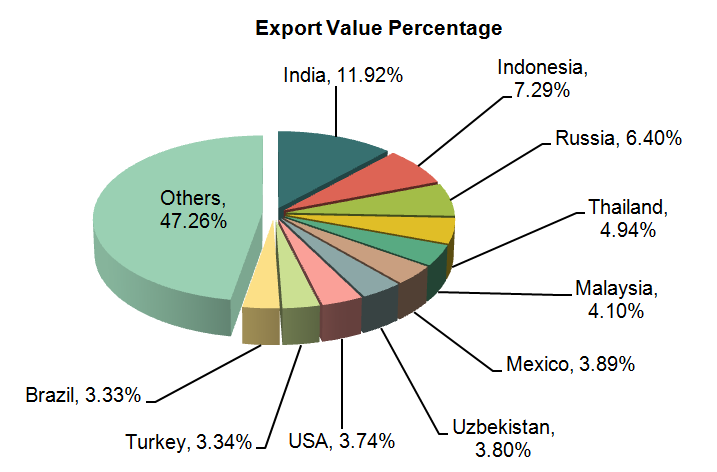
China Exports Information (Including Volume, Value and Country/Reagion) of Other Machinetools for Working Metal or Cermets, Without Removing Material Unit from (HS:8463) Jan. to Jun. of 2013 (Ranked by Export Value)
| No. | Country/Region | from Jan. to Jun. total | Compared with the same period of last year | ||
| Volume(Kg) | Value(USD) | Volume | Value | ||
| 1 | India | 609 | 10,615,224 | 22.3% | 80.5% |
| 2 | Indonesia | 710 | 6,496,021 | -18.7% | -34.8% |
| 3 | Russia | 340 | 5,701,171 | 36.0% | 102.8% |
| 4 | Thailand | 438 | 4,402,848 | -11.0% | -2.2% |
| 5 | Malaysia | 410 | 3,654,833 | -17.5% | -32.0% |
| 6 | Mexico | 121 | 3,462,492 | -5.5% | 35.8% |
| 7 | Uzbekistan | 165 | 3,381,151 | 153.8% | 337.6% |
| 8 | USA | 1,084 | 3,331,317 | 442.0% | -60.7% |
| 9 | Turkey | 230 | 2,974,278 | 27.8% | -8.5% |
| 10 | Brazil | 497 | 2,963,969 | 0.2% | 18.6% |
Accodring to export data from Jan. to Jun. of 2013, China machine tools (Other machinetools for working metal or cermets,without removing material Unit) export value reached $ 89 million, which dropped 15% as before. The mainly export countries include India, Indonesia, Russia, Thailand, USA, Malaysia, Mexico, Uzbekistan, USA, Turkey and Brazil. As the biggest consumption market, India took 111.92% of China whole value. At top 10 export markets, the growth rate of export value to Russia and Uzbekistan is over 102.8% and 337.6% at the first half of 2013
China Exports Information (Including Volume, Value and Country/Reagion) of Machinetools for Working Stone, Ceramics, Concrete, Asbestoscement or Like Mineral Materials or for Cold Working Glass (HS:8464) from Jan. to Jun. of 2013 (Ranked by Export Value)
| No | Country/Region | from Jan. to Jun. Total | Compared with the same period of last year | ||
| Volume(Unit) | Value(USD) | Volume | Value | ||
| 1 | Veitnam | 25,918 | 71,526,091 | 8.1% | 648.6% |
| 2 | USA | 376,043 | 24,544,639 | -22.2% | 7.7% |
| 3 | India | 61,336 | 23,269,496 | 67.2% | 24.7% |
| 4 | Russia | 179,418 | 16,685,026 | 25.7% | 50.3% |
| 5 | Malaysia | 18,133 | 11,059,928 | 122.5% | 89.8% |
| 6 | Egypt | 5,365 | 9,917,620 | -16.3% | 70.7% |
| 7 | Brazil | 36,882 | 9,096,603 | -19.5% | 18.5% |
| 8 | Turkey | 4,769 | 8,535,130 | -36.8% | 18.4% |
| 9 | Indoneisa | 9,830 | 7,643,395 | 69.4% | 9.9% |
| 10 | UAE | 20,645 | 6,623,205 | 2.5% | 146.6% |
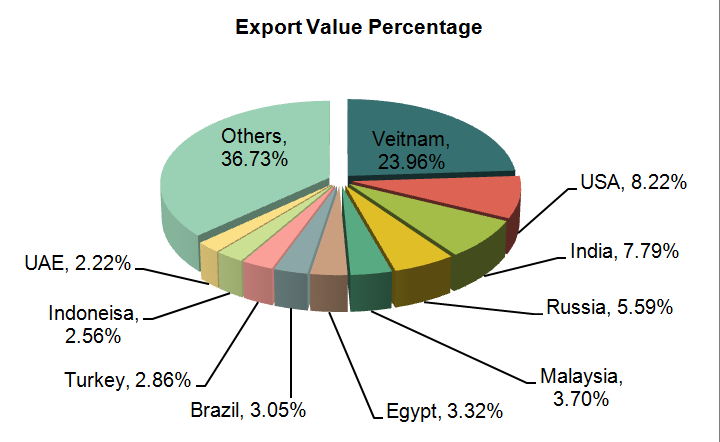
Accodring to export data from Jan. to Jun. of 2013, China machine tools (Machinetools for working stone,ceramics,concrete,asbestoscement or like mineral materials or for cold working glass) export value reached $ 299 million, which increased 58.6% as before. The mainly export countries include veitnam, USA, India, Indonesia , Russia, Malaysia, Egypt, Brazil, Turkey, Indonesia and UAE. As the biggest consumption market, Veitnam took 23.96% of China whole value. At top 10 export markets, The growth rate of export value to UAE is over 146.6% at the first half of 2013.
China Exports Information (Including Volume, Value and Country/Reagion) of Machine Tools (Including Machines for Nailing,Stapling,Glueing or Otherwise Assembling) for Working Wood,Cork,Bone,Hard Rubber,Hard Plastics or Similar Hard Materials (HS:8465) from Jan. to Jun. of 2013 (Ranked by Export Value)
| No | Country/Region | from Jan. to Jun. total | Compared with the same periof of last year | ||
| Volume(Unit) | Value(usd) | Volume | Value | ||
| 1 | USA | 777,797 | 86,519,404 | 22.5% | 24.1% |
| 2 | Germany | 443,590 | 53,359,432 | 14.3% | 12.3% |
| 3 | Russia | 95,745 | 23,190,552 | -5.4% | -15.5% |
| 4 | Canada | 145,811 | 17,199,328 | -24.0% | -20.0% |
| 5 | Australia | 99,726 | 16,999,585 | 20.2% | 8.8% |
| 6 | UK | 107,115 | 10,191,352 | -2.8% | -6.2% |
| 7 | Indonesia | 23,950 | 9,983,478 | 112.4% | 27.5% |
| 8 | Brazil | 49,468 | 8,594,183 | 21.5% | -0.6% |
| 9 | Iran | 3,238 | 7,810,128 | -36.1% | -6.5% |
| 10 | Finland | 50,587 | 7,690,310 | 44.2% | 35.6% |
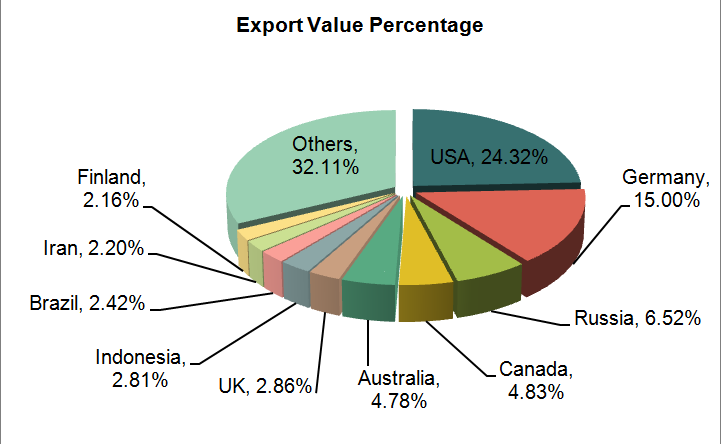
Accodring to export data from Jan. to Jun. of 2013, China machine tools (Machinetools for working stone,ceramics,concrete,asbestoscement or like mineral materials or for cold working glass) export value reached $ 356 million, which dropped 0.1% only as before. The mainly export countries include USA, Germany, Russia, Canada, Australia, UK, Indonesia, Brazil, Iran and Finland. As the biggest consumption market, USA took 24.32% of China whole value.
Data Source: China Custom


