China Marble, Travertine and Other Calcareous Monumental or Building Stone (HS: 2515) Export Volume and Value, from Jan. to Dec. 2014
| Month | Volume (KG) | Value (USD) | Compared to the Same Period of 2013 | |
| Volume | Value | |||
| Jan. | 13,064,836 | 2,119,908 | 105.8% | 8% |
| Feb. | 1,956,337 | 806,489 | -72.5% | -32.2% |
| Mar. | 5,039,845 | 1,127,009 | 144.1% | -16.7% |
| Apr. | 9,227,053 | 1,570,906 | -31.1% | -59.8% |
| May | 11,428,286 | 4,204,669 | 35.1% | 209.4% |
| Jun. | 8,591,497 | 1,245,825 | -2% | 25.2% |
| Jul. | 5,591,299 | 3,274,101 | -30% | 182.7% |
| Aug. | 7,773,134 | 2,588,827 | 5.4% | 56.1% |
| Sep. | 8,525,235 | 1,197,778 | 164.5% | 75.9% |
| Oct. | 4,943,020 | 2,488,552 | -47.3% | 92.9% |
| Nov. | 14,809,918 | 2,268,531 | 31% | 4.1% |
| Dec. | 9,968,212 | 1,064,924 | 275% | -2.7% |
| Total of Jan. to Dec. | 100,918,672 | 23,957,519 | 14.6% | 27.2% |
From Jan. to Dec. 2014, China Marble, Travertine and Other Calcareous Monumental or Building Stone Cumulative export volume was 100900 tons, export value reached 23.96 US million dollars. The export volume increased 14.6% year-on-year (YOY); the export value increased 27.2% year-on-year (YOY).
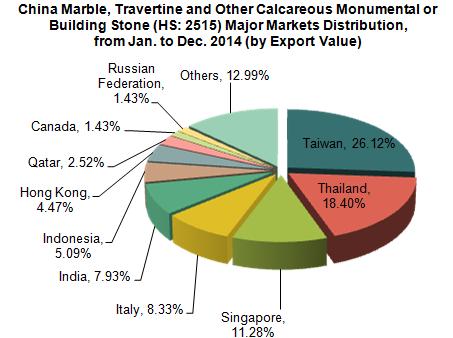
China Marble, Travertine and Other Calcareous Monumental or Building Stone (HS: 2515) Major Export Countries/Regions Distribution, from Jan. to Dec. 2014
| No. | Country/Region | Volume (KG) | Value (USD) | Compared to the Same Period of 2013 | |
| Volume | Value | ||||
| 1 | Taiwan | 67,579,773 | 6,257,412 | 9.7% | 44.7% |
| 2 | Thailand | 4,863,922 | 4,408,224 | 26.6% | 244.7% |
| 3 | Singapore | 981,462 | 2,702,459 | -58.9% | 14.9% |
| 4 | Italy | 5,511,900 | 1,996,697 | 27.7% | 48.7% |
| 5 | India | 7,169,432 | 1,900,112 | 40.6% | -8.8% |
| 6 | Indonesia | 3,962,053 | 1,219,598 | 134.9% | 37.1% |
| 7 | Hong Kong | 5,571,155 | 1,070,627 | 14.1% | 1.5% |
| 8 | Qatar | 693,606 | 604,420 | / | / |
| 9 | Canada | 39,297 | 342,837 | 369.8% | 692.3% |
| 10 | Russian Federation | 465,576 | 342,743 | 21% | 163.4% |

Taiwan was China major Marble, Travertine and Other Calcareous Monumental or Building Stone largest export markets, from Jan. to Dec. 2014, the export value to Taiwan was 6.26 million US dollars, which increased 44.7% YOY and accounted for 26.12% of the total. Followed by Thailand, the market share was 18.4%.
From Jan. to Dec. 2014, among the first-ten export countries/regions, the export volume and value to Canada increased fastest, the export volume increased 369.8% year-on-year (YOY); the export value increased 692.3% year-on-year (YOY).
China Marble, Travertine and Other Calcareous Monumental or Building Stone (HS: 2515) Original Places of Exported Goods, from Jan. to Dec. 2014
| No. | Region | Volume (KG) | Value (USD) | Compared to the Same Period of 2013 | |
| Volume | Value | ||||
| 1 | Guangdong | 15,860,908 | 11,867,634 | 22.5% | 130.2% |
| 2 | Jiangxi | 15,840,832 | 5,350,793 | 77.7% | 75.9% |
| 3 | Fujian | 9,205,292 | 1,736,528 | -33.6% | -12.4% |
| 4 | Shanghai | 3,347,095 | 1,378,019 | 20.5% | 9.8% |
| 5 | Guangxi | 39,053,609 | 683,566 | -6.4% | -21% |
| 6 | Liaoning | 2,696,389 | 589,407 | -16.3% | -78% |
| 7 | Hebei | 1,449,886 | 455,719 | 327.8% | 289.6% |
| 8 | Hubei | 1,419,805 | 328,063 | 71.2% | 98.2% |
| 9 | Beijing | 167,989 | 283,453 | 152.7% | 481.8% |
| 10 | Shandong | 955,320 | 238,249 | 21.3% | 56.9% |
From Jan. to Dec.2014, the Chinese Marble, Travertine and Other Calcareous Monumental or Building Stone original places of exported goods were Guangdong, Jiangxi, Fujian and Shanghai. Among the four provinces, the total export volume accounted for 43.85% of the total of Chinese export volume, the export value accounted for 84.87% of the total export value.
It’s noteworthy that the export volume of Guangxi accounted for 38.7% of the total, but the export value only accounted for 2.85% of the total.
Among the first ten largest Chinese Marble, Travertine and Other Calcareous Monumental or Building Stone original places of exported goods, Beijing's export value increased obviously, which increased 481.8% year-on-year (YOY).


