Japanese Imports of Seats and Parts (HS: 9401) Industry from 2010 to 2012
Japanese Annual Imports Trend of Seats and Parts from 2010 to 2012

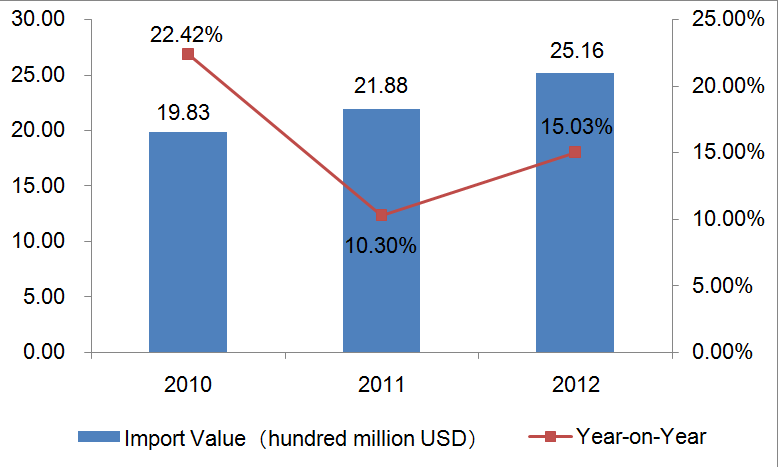
The imports of seats and parts increased year by year from 2010 to 2012. The import value in the three years amounted respectively to $ 1.983 billion (an increase of 22.42%), $ 2.188 billion (down by 10.30%) and $ 2.516 billion (down by 15.03%).
The Major Origin Countries / Regions of Japanese Seats and Parts Imports from 2010 to 2012 (Unit: Thousand Dollars)
| Countries/Regions | 2010 | 2011 | 2012 |
| China | 1,212,544 | 1,359,099 | 1,593,517 |
| Mexico | 178,748 | 167,541 | 165,401 |
| Thailand | 96,117 | 109,281 | 122,198 |
| Vietnam | 65,651 | 76,848 | 106,725 |
| Taiwan | 73,885 | 81,607 | 89,467 |
| USA | 36,077 | 42,430 | 54,371 |
| Italy | 40,324 | 48,567 | 51,866 |
| Germany | 35,668 | 37,762 | 50,057 |
| Indonesia | 39,122 | 41,502 | 46,487 |
| Malaysia | 36,029 | 34,320 | 38,846 |
| United Kingdom | 25,346 | 27,534 | 28,669 |
| Canada | 36,821 | 22,974 | 25,662 |
| France | 12,393 | 35,282 | 23,225 |
| Denmark | 13,585 | 14,899 | 18,477 |
| Korea | 9,817 | 16,863 | 17,332 |
| Norway | 13,265 | 14,351 | 16,934 |
| Philippine | 13,774 | 12,005 | 12,143 |
| South Africa | 5,412 | 5,116 | 5,398 |
| Austria | 2,398 | 3,070 | 5,010 |
| Sweden | 3,107 | 4,519 | 4,578 |
The Market Share Trend of Major Origin Countries / Regions of Japanese Seats and Parts Imports from 2010 to 2012
| Countries/Regions | 2010 | 2011 | 2012 |
| China↑ | 61.14% | 62.13% | 63.33% |
| Mexico↓ | 9.01% | 7.66% | 6.57% |
| Thailand | 4.85% | 5.00% | 4.86% |
| Vietnam↑ | 3.31% | 3.51% | 4.24% |
| Taiwan | 3.73% | 3.73% | 3.56% |
| USA↑ | 1.82% | 1.94% | 2.16% |
| Italy | 2.03% | 2.22% | 2.06% |
| Germany | 1.80% | 1.73% | 1.99% |
| Indonesia↓ | 1.97% | 1.90% | 1.85% |
| Malaysia↓ | 1.82% | 1.57% | 1.54% |
| United Kingdom↓ | 1.28% | 1.26% | 1.14% |
| Canada↓ | 1.86% | 1.05% | 1.02% |
| France | 0.62% | 1.61% | 0.92% |
| Denmark | 0.68% | 0.68% | 0.73% |
| Korea | 0.49% | 0.77% | 0.69% |
| Norway | 0.67% | 0.66% | 0.67% |
| Philippine↓ | 0.69% | 0.55% | 0.48% |
| South Africa↓ | 0.27% | 0.23% | 0.21% |
| Austria↑ | 0.12% | 0.14% | 0.20% |
| Sweden | 0.16% | 0.21% | 0.18% |
Note: ↑represents the amount of imports from the country in 2010-2012 accounted for the proportion of Chinese total exports kept rising. ↓represents the amount of imports from the country in 2010-2012 accounted for the proportion of Chinese total exports continued to decline.
The changes trend in market share from 2010 to 2012 shows that the countries to which the market share continued to rise are: China, Vietnam, USA and Austria; And the countries to which the market share continued to decline are: Mexico, Indonesia, Malaysia, United Kingdom, Canada, Philippine and South Africa.
Japanese Imports of Other Furniture and Parts (HS: 9403) Industry from 2010 to 2012
Japanese Annual Imports Trend of Other Furniture and Parts from 2010 to 2012

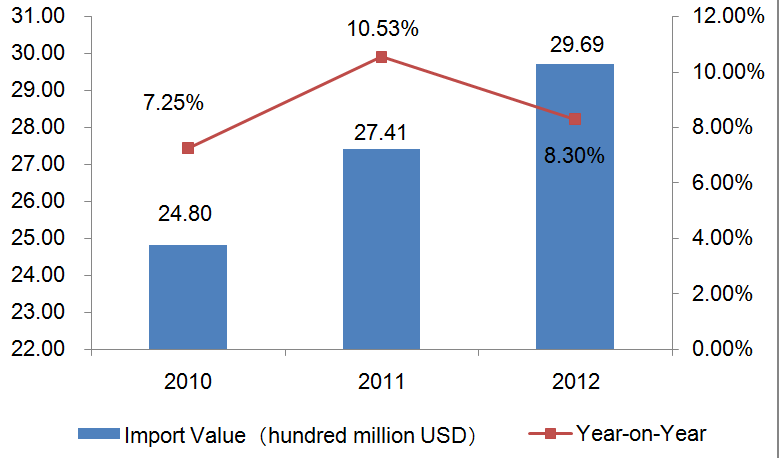
Japanese import value of other furniture and parts declined year after year from 2010 to 2012. The imports in the three years amounted respectively to $ 2.48 billion (an increase of 7.25%), $ 2.741 billion (an increase of 10.53%) and $ 2.969 billion (an increase of 8.30%).
The Major Origin Countries / Regions of Japanese Other Furniture and Parts Imports from 2010 to 2012 (Unit: Thousand Dollars)
| Countries/Regions | 2010 | 2011 | 2012 |
| China | 1,183,484 | 1,299,725 | 1,388,954 |
| Vietnam | 281,013 | 322,486 | 369,724 |
| Taiwan | 155,345 | 189,361 | 222,058 |
| Malaysia | 178,483 | 176,474 | 220,907 |
| Indonesia | 196,987 | 209,714 | 217,466 |
| Thailand | 127,889 | 130,514 | 117,184 |
| Austria | 70,412 | 90,314 | 86,611 |
| Philippine | 59,674 | 78,139 | 83,789 |
| Italy | 41,553 | 48,979 | 49,244 |
| Germany | 35,611 | 32,526 | 37,422 |
| USA | 30,903 | 31,924 | 32,913 |
| Poland | 21,919 | 28,770 | 30,302 |
| Korea | 21,154 | 22,426 | 23,846 |
| United Kingdom | 9,918 | 10,056 | 12,093 |
| Denmark | 9,012 | 9,775 | 9,963 |
| Portugal | 8,353 | 8,972 | 7,711 |
| Sweden | 6,085 | 8,128 | 7,154 |
| Turkey | 3,941 | 4,401 | 6,628 |
| France | 3,513 | 5,125 | 5,405 |
| Spain | 1,975 | 2,712 | 5,177 |
The Market Share Trend of Major Origin Countries / Regions of Japanese Other Furniture and Parts Imports from 2010 to 2012
| Countries/Regions | 2010 | 2011 | 2012 |
| China↓ | 47.72% | 47.41% | 46.78% |
| Vietnam↑ | 11.33% | 11.76% | 12.45% |
| Taiwan↑ | 6.26% | 6.91% | 7.48% |
| Malaysia | 7.20% | 6.44% | 7.44% |
| Indonesia↓ | 7.94% | 7.65% | 7.32% |
| Thailand↓ | 5.16% | 4.76% | 3.95% |
| Austria | 2.84% | 3.29% | 2.92% |
| Philippine | 2.41% | 2.85% | 2.82% |
| Italy | 1.68% | 1.79% | 1.66% |
| Germany | 1.44% | 1.19% | 1.26% |
| USA↓ | 1.25% | 1.16% | 1.11% |
| Poland | 0.88% | 1.05% | 1.02% |
| Korea↓ | 0.85% | 0.82% | 0.80% |
| United Kingdom | 0.40% | 0.37% | 0.41% |
| Denmark | 0.36% | 0.36% | 0.34% |
| Portugal↓ | 0.34% | 0.33% | 0.26% |
| Sweden | 0.25% | 0.30% | 0.24% |
| Turkey | 0.16% | 0.16% | 0.22% |
| France | 0.14% | 0.19% | 0.18% |
| Spain↑ | 0.08% | 0.10% | 0.17% |
Note: ↑represents the amount of imports from the country in 2010-2012 accounted for the proportion of Chinese total exports kept rising. ↓represents the amount of imports from the country in 2010-2012 accounted for the proportion of Chinese total exports continued to decline.
The changes trend in market share from 2010 to 2012 shows that the countries to which the market share continued to rise are: Vietnam, Taiwan and Spain; And the countries to which the market share continued to decline are: China, Indonesia, Thailand, USA, Korea and Portugal.
Japanese Imports of Spring Mattress, Bedding and Similar Products (HS: 9404) Industry from 2010 to 2012
Japanese Annual Imports Trend of Spring Mattress, Bedding and Similar Products from 2010 to 2012

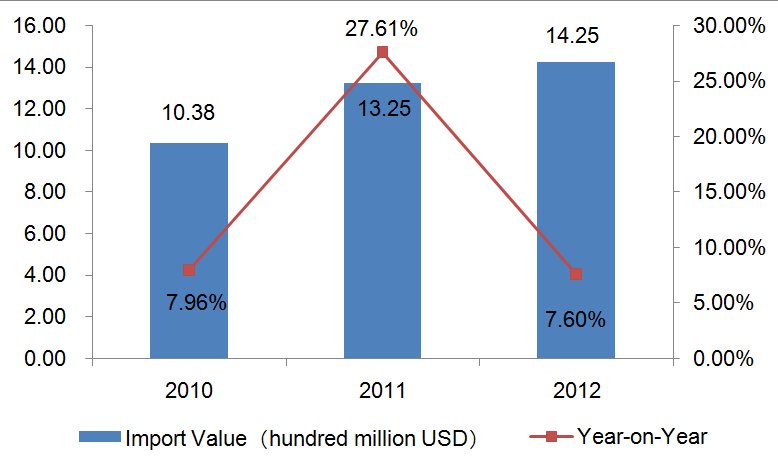
Japanese import value of spring mattress, bedding and similar products declined year after year from 2010 to 2012. The imports in the three years amounted respectively to $ 11.218 billion (an increase of 15.59%), $ 12.657 billion (an increase of 12.83%) and $ 12.905 billion (an increase of 1.95%).
The Major Origin Countries / Regions of Japanese Spring Mattress, Bedding and Similar Products Imports from 2010 to 2012(Unit: Thousand Dollars)
| Countries/Regions | 2010 | 2011 | 2012 |
| China | 900,278 | 1,163,067 | 1,243,427 |
| Vietnam | 28,571 | 36,973 | 45,616 |
| Denmark | 17,193 | 21,064 | 27,646 |
| Italy | 15,384 | 23,234 | 27,373 |
| USA | 18,977 | 17,533 | 20,540 |
| Germany | 10,665 | 11,105 | 11,462 |
| Malaysia | 8,301 | 9,193 | 8,683 |
| Taiwan | 6,590 | 8,077 | 7,565 |
| Thailand | 4,188 | 4,680 | 6,375 |
| Korea | 3,156 | 4,819 | 4,327 |
| Canada | 3,980 | 4,753 | 3,238 |
| India | 1,309 | 1,715 | 2,834 |
| Poland | 1,534 | 1,317 | 2,191 |
| Indonesia | 1,931 | 2,639 | 1,694 |
| Sri Lanka | 748 | 1,041 | 1,487 |
| Estonia | 2,111 | 1,356 | 1,473 |
| Norway | 530 | 458 | 1,438 |
| Brazil | 4,490 | 3,843 | 1,391 |
| Sweden | 1,230 | 1,112 | 1,130 |
| Swiss | 858 | 856 | 1,006 |
The Market Share Trend of Major Origin Countries /Regions of Japanese Spring Mattress, Bedding and Similar Products Imports from 2010 to 2012
| Countries/Regions | 2010 | 2011 | 2012 |
| China | 86.74% | 87.81% | 87.25% |
| Vietnam↑ | 2.75% | 2.79% | 3.20% |
| Denmark | 1.66% | 1.59% | 1.94% |
| Italy↑ | 1.48% | 1.75% | 1.92% |
| USA | 1.83% | 1.32% | 1.44% |
| Germany↓ | 1.03% | 0.84% | 0.80% |
| Malaysia↓ | 0.80% | 0.69% | 0.61% |
| Taiwan↓ | 0.63% | 0.61% | 0.53% |
| Thailand | 0.40% | 0.35% | 0.45% |
| Korea | 0.30% | 0.36% | 0.30% |
| Canada↓ | 0.38% | 0.36% | 0.23% |
| India | 0.13% | 0.13% | 0.20% |
| Poland | 0.15% | 0.10% | 0.15% |
| Indonesia | 0.19% | 0.20% | 0.12% |
| Sri Lanka↑ | 0.07% | 0.08% | 0.10% |
| Estonia | 0.20% | 0.10% | 0.10% |
| Norway | 0.05% | 0.03% | 0.10% |
| Brazil↓ | 0.43% | 0.29% | 0.10% |
| Sweden | 0.12% | 0.08% | 0.08% |
| Swiss | 0.08% | 0.06% | 0.07% |
Note: ↑represents the amount of imports from the country in 2010-2012 accounted for the proportion of Chinese total exports kept rising. ↓represents the amount of imports from the country in 2010-2012 accounted for the proportion of Chinese total exports continued to decline.
The changes trend in market share from 2010 to 2012 shows that the countries to which the market share continued to rise are: Vietnam, Italy and Sri Lanka; And the countries to which the market share continued to decline are: Germany, Malaysia, Taiwan, USA, Canada and Brazil.
Source:UN COMTRADE


