China Bottling or Canning Machinery for Beverages or Liquid Food (HS: 842230) Export Enterprises Distribution from Jan. to Dec. 2014 (by export value)
| Region | Volume (Set) | Value (USD) | Compared with the same period of last year | |
| Volume | Value | |||
| Guangdong | 2,456,043 | 220,809,217 | 40.2% | 2.7% |
| Jiangsu | 12,920 | 121,037,236 | -5.4% | -4% |
| Shanghai | 11,047 | 106,313,524 | -4.3% | 47.8% |
| Zhejiang | 861,412 | 72,121,442 | -12.4% | 5.3% |
| Shandong | 10,629 | 15,841,194 | 111.5% | -7% |
| Hunan | 458 | 12,842,796 | -27.2% | -9.2% |
| Beijing | 265 | 8,063,090 | -14.2% | -9.4% |
| Hebei | 555 | 7,304,225 | 37.7% | 36% |
| Liaoning | 6,361 | 6,625,216 | -15.6% | 39.8% |
| Anhui | 907 | 5,576,842 | -74.5% | -41.9% |
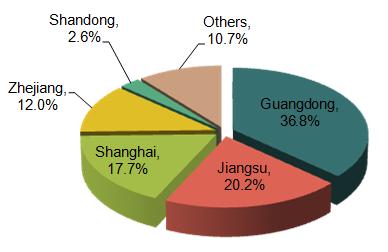
As can be seen from the export data of Jan.-Dec. 2014, China Bottling or canning machinery for beverages or liquid food original places of exported goods are Guangdong, Jiangsu and Shanghai, among which, the export value of Guangdong accounted for 36.8% of the total export value of our country.
China other Packing or Wrapping Machinery (Including Heatshrink Wrapping Machinery) (HS: 842240) Export Enterprises Distribution from Jan. to Dec. 2014 (by export value)
| Region | Volume (Set) | Value (USD) | Compared with the same period of last year | |
| Volume | Value | |||
| Zhejiang | 1,188,931 | 93,997,300 | 16.1% | 10.2% |
| Guangdong | 652,580 | 82,801,047 | -18.3% | -15.7% |
| Shanghai | 261,893 | 61,476,140 | 160.4% | -4.2% |
| Jiangsu | 164,211 | 44,433,429 | 70.8% | 10.5% |
| Beijing | 28,729 | 17,661,508 | -8.3% | -9.7% |
| Shandong | 9,272 | 16,578,241 | -12.2% | 32.2% |
| Hebei | 3,230 | 7,894,395 | 37.2% | 1.2% |
| Tianjin | 2,211 | 5,598,975 | 97.2% | -52.5% |
| Fujian | 16,409 | 5,544,143 | 398.3% | 28.4% |
| Sichuan | 384 | 3,884,678 | -34.1% | 1.6% |

As can be seen from the export data of Jan.-Dec. 2014, China Other packing or wrapping machinery (including heatshrink wrapping machinery) original places of exported goods are Zhejiang, Guangdong and Shanghai, among which, the export value of Zhejiang and Guangdong accounted for 26.2% and 23.1% respectively of the total export value of our country.
2.3. China Parts for 8422 (HS: 842290) Export Enterprises Distribution from Jan. to Dec. 2014 (by export value)
| Region | Volume (Kg) | Value (USD) | Compared with the same period of last year | |
| Volume | Value | |||
| Guangdong | 9,029,139 | 118,747,800 | 40.8% | 90.3% |
| Zhejiang | 4,486,085 | 45,122,625 | 6.6% | 0.7% |
| Jiangsu | 3,031,630 | 36,511,181 | 49.8% | 25.1% |
| Shanghai | 1,059,713 | 28,450,271 | -10.9% | 5.1% |
| Shandong | 1,057,133 | 13,584,447 | -0.2% | 19.2% |
| Hebei | 340,546 | 5,502,147 | 5.3% | -15% |
| Fujian | 801,575 | 5,138,351 | 10% | 78.5% |
| Anhui | 1,199,112 | 3,891,322 | -4.2% | 25.3% |
| Beijing | 295,937 | 3,468,934 | 42.9% | -17.2% |
| Liaoning | 52,727 | 1,980,610 | -41% | 108.2% |
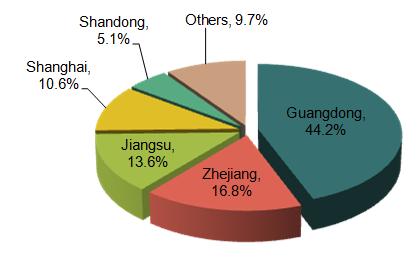
As can be seen from the export data of Jan.-Dec. 2014, China Parts for 8422 original places of exported goods are Guangdong, Zhejiang and Jiangsu, among which, the export value of Guangdong accounted for 44.2% of the total export value of our country.
Source: Customs Information Network


