Note:
| HS Code | Product Name |
| 92 | Musical instruments, parts & accessories |
China Musical Instrument, Parts & Accessories Export Volume and Value from Jan. to October in 2013
| Month | Volume (Set) | Value (USD) | Compared to the Same Period of Last Year | ||
| Volume | Value | ||||
| January | 14,526,306 | 139,206,963 | -7.9% | 23.9% | |
| February | 10,142,178 | 94,529,657 | 75.7% | 32.9% | |
| March | 10,914,550 | 91,102,117 | -33% | -24.4% | |
| April | 14,457,198 | 122,846,868 | -17.5% | -11.2% | |
| May | 15,800,790 | 135,012,159 | -14.6% | -14.6% | |
| June | 15,565,146 | 133,351,935 | 1.8% | -12% | |
| July | 22,754,969 | 161,828,499 | 16.6% | 1.8% | |
| August | 19,762,004 | 163,596,025 | 14.2% | -7.1% | |
| September | 19,637,170 | 159,091,985 | 6.4% | -11% | |
| October | 15,840,084 | 157,919,535 | 5.6% | 2.4% | |
| Jan. to October Total | 159,400,395 | 1,358,485,743 | 0 | -4.3% | |
The export value of China musical instrument, parts & accessories from Jan. to October in 2013 amounted to 1.358 billion US dollars, with a decrease of 4.3%. Among the first ten months of 2013, the export volume and value of China musical instrument, parts & accessories in February both increased significantly year on year. The export volume increased by 75.7% year on year, while the export value increased by 32.9%.
China Musical Instrument, Parts & Accessories Major Export Countries/Regions Distribution from Jan. to October in 2013
| No. | Countries | Volume (-) | Value (USD) | Compared to the Same Period of Last Year | |
| Volume | Value | ||||
| 1 | USA | 29,060,494 | 359,842,189 | -7.7% | -4.1% |
| 2 | Germany | 6,112,011 | 105,911,311 | -36.1% | -12.9% |
| 3 | Japan | 8,206,794 | 75,881,542 | -25.1% | -15.6% |
| 4 | Brazil | 6,395,733 | 59,544,674 | 62.1% | -8.2% |
| 5 | Hong Kong | 8,048,441 | 58,150,247 | -22.2% | -8.3% |
| 6 | UK | 3,780,023 | 52,964,810 | -10.9% | 1.9% |
| 7 | Indonesia | 8,094,918 | 50,376,982 | 1.5% | 5.7% |
| 8 | Netherlands | 5,111,811 | 43,042,462 | -7.1% | -7.3% |
| 9 | South Korea | 3,391,592 | 40,574,084 | -5.3% | -11.4% |
| 10 | France | 3,847,202 | 32,695,867 | 132.9% | -10% |
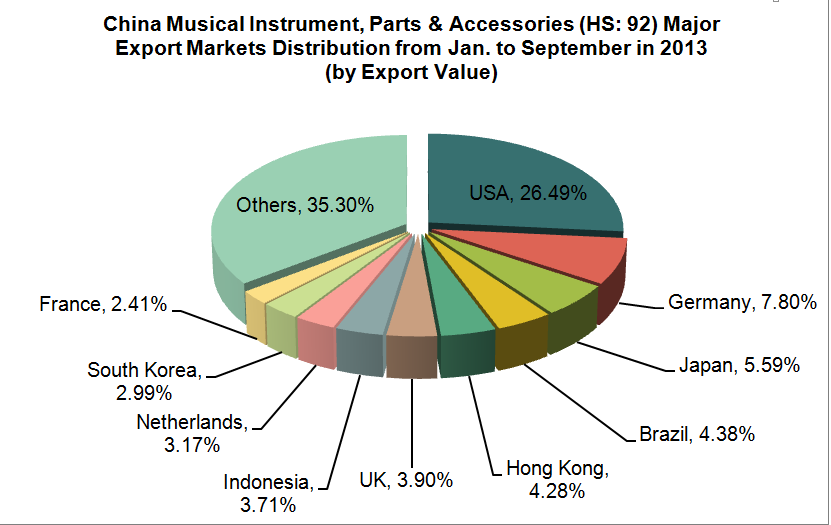
China's main export markets of musical instrument, parts & accessories were the United States, Germany, Japan, Brazil and Hong Kong and etc. from Jan. to October in 2013. The export value to the United States accounted for 26.49% of our country's total export value of the product.
China Musical Instrument, Parts & Accessories Export Source Areas from Jan. to October in 2013
| No. | Regions | Volume (-) | Value (USD) | Compared to the Same Period of Last Year | |
| Volume | Value | ||||
| 1 | Guangdong | 39,999,070 | 506,782,326 | 0 | 4% |
| 2 | Tianjin | 10,399,883 | 240,828,478 | -12.1% | -10% |
| 3 | Zhejiang | 77,288,063 | 131,076,488 | 8.9% | 0.8% |
| 4 | Jiangsu | 9,838,194 | 117,410,818 | -11.9% | -7.5% |
| 5 | Shanghai | 5,608,509 | 104,739,859 | -7.7% | -12.9% |
| 6 | Shandong | 2,550,478 | 56,039,428 | -15% | -20.8% |
| 7 | Hebei | 4,932,331 | 39,066,151 | 7.6% | 7% |
| 8 | Liaoning | 654,645 | 38,151,181 | -38.7% | -1.6% |
| 9 | Beijing | 587,458 | 37,832,829 | -20.2% | 1.4% |
| 10 | Fujian | 2,372,186 | 27,975,036 | -10.5% | -30.7% |
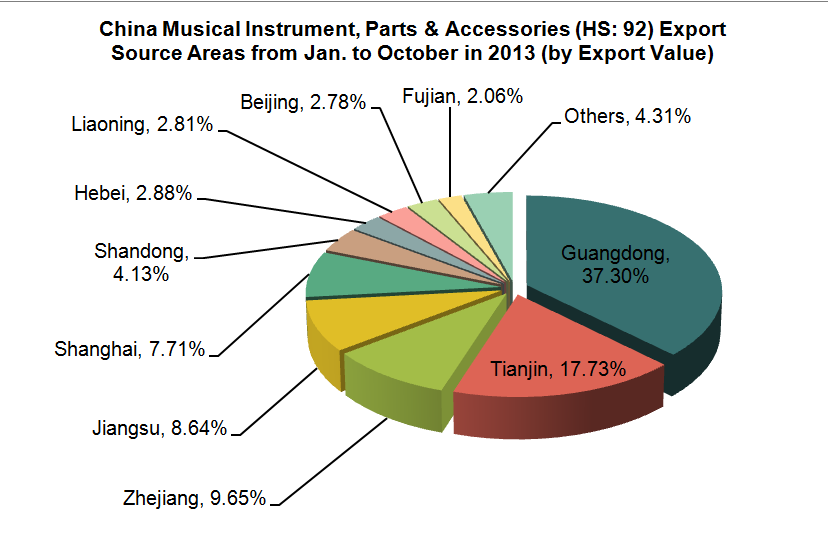
Guangdong and Tianjin are our country's musical instrument, parts & accessories major export source areas. From Jan. to October in 2013, the export value of the above two areas accounted for 37.30% and 17.73 respectively of the total export value of the product.
(Source: China Customs Network)


