Spatial pattern recognition
Spatial pattern recognition (SPR) looks for relationships among defect locations on the substrate surface. When detected, spatial patterns can often lead to rapid identification of the defect's root cause (Fig. 2). The green map is a composite of 589 individual defect maps. The scratch readily apparent in the composite map was invisible in the individual maps. Further analysis revealed that the scratch killed 14–28 die 35% of the time, representing over US$500,000 / year for this issue alone.
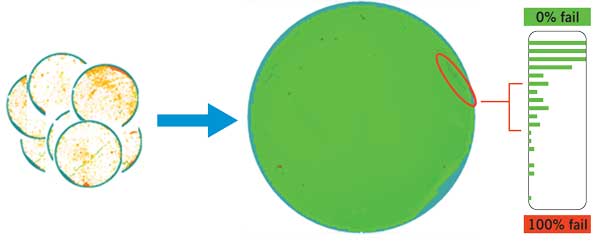
Figure 2. When detected, spatial patterns can often lead to rapid identification of the defect's root cause.
Automated fault detection and classification
Engineers are alerted of the occurrence and type of failure conditions using automated fault detection and classification (FDC), which monitors process equipment. In MOCVD applications, FDC can provide traceability down to the individual reactor chamber and even the specific substrate pocket (Fig. 3). Bin yield data (right) indicated low yield for die from substrates processed in pocket 6. Further analysis revealed a spatial pattern with the defective die located near the edge of the substrate on one side. Engineers traced the problem to contamination in pocket 6 that was missed by photoluminescence mapping and other in-line monitoring.
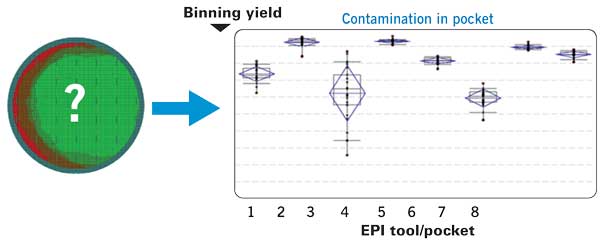
Figure 3.In MOCVD applications, FDC can provide traceability down to the individual reactor chamber and even the specific substrate pocket.
Predictive maintenance
Predictive maintenance improves productivity by avoiding the unscheduled downtime that occurs with run-to-fail approach to equipment maintenance, while also reducing unnecessary scheduled downtime that occurs with strictly periodic maintenance. Predictive maintenance requires a precise and reliable indicator of imminent failure. In Fig. 4, the pressure differential across a filter is used to predict the need to change out the filter. In Fig. 5, the frequency and amplitude of spikes from a mass flow controller indicate the need for maintenance. Automated FDC can monitor these and other equipment parameters to alert engineers of the need for maintenance.
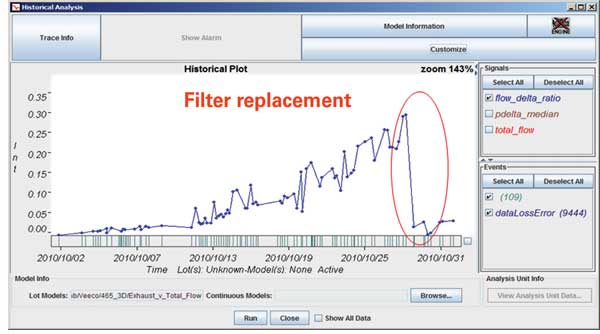
Figure 4.Increasing pressure differential across a filter can be used to predict the need for maintenance. After changing the filter, the pressure differential drops back to a baseline level.
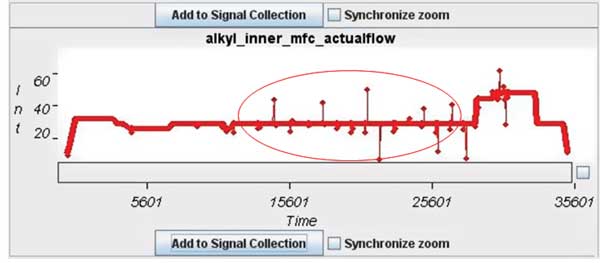
Figure 5.The frequency and amplitude of spikes from a mass flow controller may predict the need for maintenance.
A case study
Figure 6 illustrates the combination of various techniques to detect and resolve a problem in an LED production line. The problem was initially detected as a yield loss due to excessive variability in the wavelength of emitted light. Commonality analysis isolated the problem to a specific reactor. Spatial pattern recognition and pocket-level traceability showed the defects concentrated near the edge of the susceptor. Analysis of sensor data from the reactor indicated a radial non-uniformity in susceptor temperature. Possible causes to be investigated include miscalibration of the outer zone pyrometer and insufficient RF power to the outer zone.
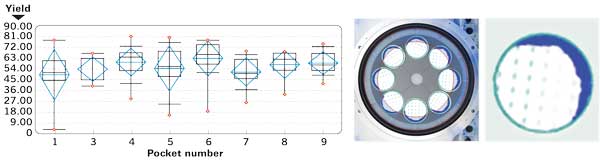
Figure 6.The combination of yield analysis, spatial pattern recognition, and fault detection classification identified non-uniform radial temperature in a specific reactor as the cause of yield loss.
With an integrated approach to data collection and analysis, manufacturers can quickly and easily detect and isolate a process issue, ultimately saving millions of dollars per year through increased yields and more efficient use of precious process engineering time.
Future opportunities
By narrowing process windows and increasing yields, advanced process control has the potential to significantly reduce the cost per unit area of MOCVD epitaxial processing, which is the most costly process in LED manufacturing. Improving bin yields also reduces assembly and packaging costs for defective die. Additional benefits may accrue from increases in die size that would be enabled by decreases in defect density. Finally, higher yields of more valuable devices can drive increases in average selling price and profitability.
Conclusion
Process control software is providing leading LED manufacturers with higher yields and better control of their manufacturing processes. By focusing yield management and process control strategies on the MOCVD process, these manufacturers are achieving significant reductions in the largest contributor to their manufacturing costs. Moreover, since process control systems scale inexpensively with changes in production capacity, technology, materials, or geographies, the investments of early adopters will be highly leveraged by future growth.


