Chinese Table Lamps & Reading Lights Industry Export from Jan. to Nov. in 2012
Export Quantity & Value for Chinese Table Lamps & Reading Lights (HS: 940520) from Jan. to Nov. in 2012
| Month | Quantity (Set) | Value (USD) | Year on Year (±%) (Quantity) | Year on Year (±%) (Value) |
| Jan. | 9,809,348 | 68,726,703 | -23.9 | -9.7 |
| Feb. | 5,685,478 | 39,110,074 | -20.8 | -4.3 |
| Mar. | 9,494,504 | 68,540,088 | -7.5 | 9.5 |
| Apr. | 10,060,669 | 67,372,582 | -9.9 | -0.4 |
| May | 13,202,711 | 80,525,144 | -14.8 | -8.5 |
| Jun. | 13,769,674 | 85,099,205 | -9.9 | -0.1 |
| Jul. | 12,625,478 | 79,228,705 | -11.9 | -5.1 |
| Aug. | 12,934,195 | 81,971,456 | -13.2 | -6.1 |
| Sep. | 12,971,736 | 86,716,446 | -5.3 | -0.7 |
| Oct. | 12,642,427 | 83,973,710 | 15.6 | 14.5 |
| Nov. | 8,909,109 | 61,891,975 | -29 | -25.8 |
| Total | 122,105,329 | 803,156,088 | -12 | -3.8 |
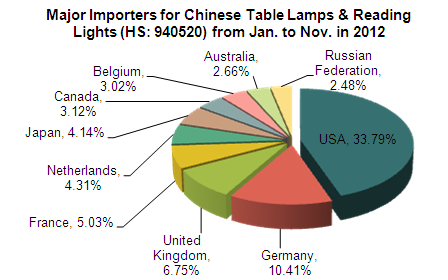
Major Importers for Chinese Table Lamps & Reading Lights (HS: 940520) from Jan. to Nov. in 2012 (Sorted by Value)
| No. | Countries/ Regions | From Jan. to Nov. in 2012 | Year on Year (±%) | ||
| Quantity (Set) | Value (USD) | Quantity | Quantity | ||
| 1 | USA | 41,218,632 | 271,360,762 | -13 | -1.6 |
| 2 | Germany | 11,174,102 | 83,614,100 | -19.7 | -7.8 |
| 3 | United Kingdom | 8,401,181 | 54,198,995 | 0.7 | 16.4 |
| 4 | France | 6,419,588 | 40,387,163 | -12.3 | -6.6 |
| 5 | Netherlands | 4,006,792 | 34,590,765 | -39.3 | -30.4 |
| 6 | Japan | 3,111,397 | 33,242,059 | -18.8 | -3.7 |
| 7 | Canada | 3,578,522 | 25,034,351 | -9.2 | 2.3 |
| 8 | Belgium | 3,356,770 | 24,228,227 | -16.6 | -8.4 |
| 9 | Australia | 3,628,424 | 21,364,292 | -6.9 | 0.3 |
| 10 | Russian Federation | 4,060,846 | 19,908,709 | 1.6 | 8.6 |
| 11 | Spain | 3,013,842 | 19,865,978 | -12.5 | -6.4 |
| 12 | Italy | 2,735,965 | 19,496,542 | -36.5 | -20.2 |
| 13 | Sweden | 3,115,263 | 17,256,297 | -9.2 | -6.7 |
| 14 | Poland | 1,739,814 | 9,169,062 | -24.7 | -21.5 |
| 15 | Austria | 981,186 | 6,567,723 | -25 | -21.8 |
| 16 | Hong Kong | 635,934 | 6,093,545 | -33.4 | -8.4 |
| 17 | United Arab Emirates | 855,734 | 5,922,413 | 12.8 | 20 |
| 18 | India | 1,467,420 | 5,767,578 | 386.1 | 242.6 |
| 19 | Brazil | 1,124,168 | 5,079,753 | -14 | -13.6 |
| 20 | Finland | 1,165,594 | 4,617,185 | 138.5 | 44.7 |
Customs’ Export Quantity&Value for Chinese Table Lamps & Reading Lights (HS: 940520) from Jan. to Nov. in 2012 (Sorted by Value)
| No. | By Customs | From Jan. to Nov. in 2012 | Year on Year (±%) | ||
| Quantity (Set) | Value (USD) | Quantity | Value | ||
| 1 | Shenzhen Customs | 56,135,978 | 386,029,781 | -12 | -1.2 |
| 2 | Shanghai Customs | 19,039,180 | 114,343,380 | 0.7 | 3.5 |
| 3 | Ningbo Customs | 20,034,937 | 101,977,496 | -9.3 | -1 |
| 4 | Huangpu Customs | 9,216,524 | 58,852,211 | -33.5 | -23.9 |
| 5 | Gongbei Customs | 4,592,829 | 49,400,590 | -17.2 | -10.7 |
| 6 | Guangzhou Customs | 4,095,396 | 33,025,828 | -11.4 | -3.7 |
| 7 | Xiamen Customs | 3,334,579 | 25,428,733 | -1.6 | -4.2 |
| 8 | Shantou Customs | 3,185,416 | 15,179,117 | -15.5 | -15.5 |
| 9 | Jiangmen Customs | 991,702 | 8,405,766 | -19.3 | -4 |
| 10 | Dalian Customs | 85,205 | 3,682,332 | 2.6 | 3 |
Major Cities/Provinces for Chinese Table Lamps & Reading Lights Export (HS: 940520) from Jan. to Nov. in 2012 (Sorted by Value)
| No. | Cities/Provinces | From Jan. to Nov. in 2012 | Year on Year (±%) | ||
| Quantity (Set) | Value (USD) | Quantity | Value | ||
| 1 | Guangdong | 78,653,957 | 548,932,426 | -15 | -5.5 |
| 2 | Zhejiang | 31,095,879 | 158,582,326 | -7.6 | -1.7 |
| 3 | Shanghai | 5,205,364 | 37,763,346 | 15.6 | 9.7 |
| 4 | Fujian | 3,130,786 | 25,833,941 | -10.4 | -6.2 |
| 5 | Jiangsu | 2,876,165 | 18,115,797 | 7.1 | 10.7 |
| 6 | Liaoning | 75,205 | 3,613,332 | -8.3 | 1.5 |
| 7 | Sichuan | 504,895 | 2,721,933 | -57.3 | -53.9 |
| 8 | Shandong | 270,879 | 2,533,418 | 2.8 | 52 |
| 9 | Hunan | 57,026 | 1,962,907 | 41525 | 8149.2 |
| 10 | Guangxi | 109,772 | 1,500,942 | -36 | -39.2 |
From Jan. to Nov. in 2012, the total export quantity for Chinese table lamps & reading lights achieved 0.122 billion sets, and the total export value was about 0.803 billion dollars, down 3.8% year on year.
The major exporters were USA, Germany and United Kingdom and so on. The export value for USA occupied 33.8% of the total export value.
The major exports Customs were Shenzhen, Shanghai and Ningbo, which export values reached 0.602 billion dollars, occupied 75% of the total export value.
The major cities and provinces concentrated in Guangdong and Zhejiang.


