China Seats and Parts Industry Export Trend Analysis
Note:
HS Code: 9401, Seats (including dual-use as a bed chair, except item HS Code: 9402) and the parts, hereinafter referred to as "Seats and parts."
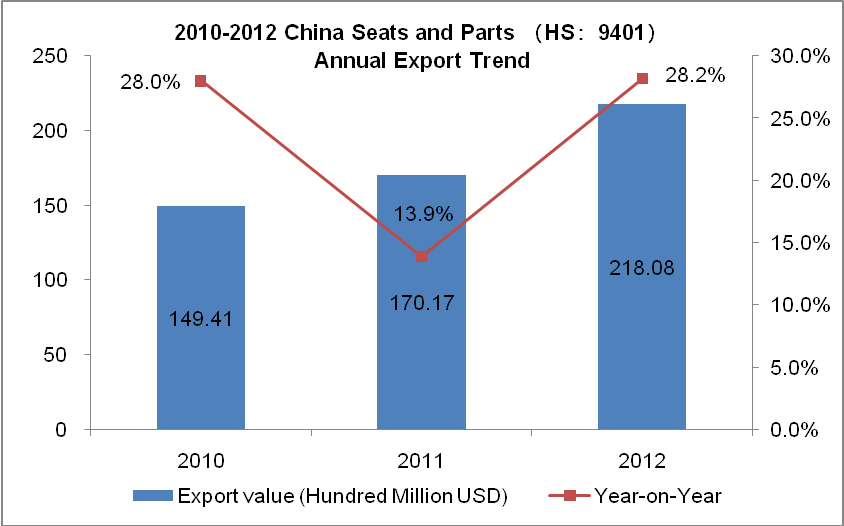
2010-2012 China Seats and Parts (HS:9401)Export Trend Analysis
2010-2012 China Seats and Parts (HS:9401)Export Amount Trend Analysis

From 2010 to 2012, China's total export of seats and parts is growing year by year, in 2012; the total export amount is approximately $ 21.808 billion, with an increase of 28.2%.
2010-2012 China Seats and Parts (HS:9401)Export Market Analysis
| No. | Export Country/Region | Export Amount (USD) | Export Growth in 2012 than in 2010 | ||
|
|
| Year 2010 | Year 2011 | Year 2012 |
|
| 1 | The USA | 5,165,835,416 | 5,653,635,761 | 6,466,995,347 | 25.19% |
| 2 | Japan | 987,806,671 | 1,135,488,742 | 1,365,209,946 | 38.21% |
| 3 | Britain | 928,333,229 | 960,563,259 | 1,141,469,351 | 22.96% |
| 4 | Germany | 788,537,042 | 982,592,433 | 1,095,090,066 | 38.88% |
| 5 | Canada | 671,807,474 | 729,968,278 | 886,064,624 | 31.89% |
| 6 | Australia | 536,469,259 | 675,884,281 | 829,578,927 | 54.64% |
| 7 | France | 488,054,761 | 546,817,442 | 631,489,816 | 29.39% |
| 8 | The Netherlands | 454,695,376 | 487,134,946 | 575,938,392 | 26.66% |
| 9 | Malaysia | 198,480,340 | 243,933,059 | 465,666,785 | 134.62% |
| 10 | South Korea | 341,230,650 | 394,586,344 | 458,053,714 | 34.24% |
| 11 | Saudi Arabia | 153,539,858 | 219,897,630 | 446,358,288 | 190.71% |
| 12 | UAE | 172,874,885 | 225,628,413 | 380,981,226 | 120.38% |
| 13 | Singapore | 154,363,253 | 172,705,260 | 380,949,567 | 146.79% |
| 14 | Hong Kong | 207,683,460 | 254,417,986 | 330,247,590 | 59.01% |
| 15 | Spain | 277,802,523 | 307,385,120 | 315,940,234 | 13.73% |
| 16 | South Africa | 108,138,522 | 148,588,039 | 313,969,322 | 190.34% |
| 17 | Brazil | 104,026,814 | 127,521,365 | 276,090,796 | 165.40% |
| 18 | Italy | 269,646,347 | 278,526,703 | 275,465,538 | 2.16% |
| 19 | Belgium | 213,257,440 | 240,142,983 | 255,116,082 | 19.63% |
| 20 | India | 128,310,889 | 150,313,380 | 231,127,831 | 80.13% |
2010-2012 China Seats and Parts (HS:9401)Export Market Share Analysis
| No. | Export Country/Region | Proportion of Export Amount | ||
|
|
| 2010 | 2011 | 2012 |
| 1 | The USA↓ | 34.57% | 33.22% | 29.65% |
| 2 | Japan | 6.61% | 6.67% | 6.26% |
| 3 | Britain↓ | 6.21% | 5.64% | 5.23% |
| 4 | Germany | 5.28% | 5.77% | 5.02% |
| 5 | Canada↓ | 4.50% | 4.29% | 4.06% |
| 6 | Australia | 3.59% | 3.97% | 3.80% |
| 7 | France↓ | 3.27% | 3.21% | 2.90% |
| 8 | The Netherlands↓ | 3.04% | 2.86% | 2.64% |
| 9 | Malaysia↑ | 1.33% | 1.43% | 2.14% |
| 10 | South Korea | 2.28% | 2.32% | 2.10% |
| 11 | Saudi Arabia↑ | 1.03% | 1.29% | 2.05% |
| 12 | UAE↑ | 1.16% | 1.33% | 1.75% |
| 13 | Singapore | 1.03% | 1.01% | 1.75% |
| 14 | Hong Kong↑ | 1.39% | 1.50% | 1.51% |
| 15 | Spain↓ | 1.86% | 1.81% | 1.45% |
| 16 | South Africa↑ | 0.72% | 0.87% | 1.44% |
| 17 | Brazil↑ | 0.70% | 0.75% | 1.27% |
| 18 | Italy↓ | 1.80% | 1.64% | 1.26% |
| 19 | Belgium↓ | 1.43% | 1.41% | 1.17% |
| 20 | India↑ | 0.86% | 0.88% | 1.06% |
Note: ↑mean that from 2010 to 2012, the proportion of imports is keep rising accounted for China’s total export amount. ↓ mean that from 2010 to 2012, the proportion of imports continued to decline accounted for China’s total export amount.
(Source:China Customs network)


