China Processed Monumental or Building Stone and Articles Thereof Export Volume and Value, from Jan. to Dec. 2014
| Month | Volume (KG) | Value (USD) | Compared to the Same Period of 2013 | |
| Volume | Value | |||
| Jan. | 853,228,969 | 532,437,099 | 5% | 12.3% |
| Feb. | 277,264,576 | 164,883,181 | -30.1% | -32.6% |
| Mar. | 851,131,665 | 460,682,358 | 21.2% | 19.9% |
| Apr. | 952,391,423 | 523,784,269 | 5.3% | 1.7% |
| May | 862,861,382 | 501,374,577 | -8.7% | -9.2% |
| Jun. | 837,555,686 | 494,560,843 | 1.5% | 0.6% |
| Jul. | 913,625,806 | 575,353,086 | 11.7% | 18% |
| Aug. | 820,252,848 | 545,653,774 | -2.9% | 11.2% |
| Sep. | 782,242,426 | 542,356,874 | -7.2% | 11.2% |
| Oct. | 815,633,247 | 540,641,632 | -3.6% | 0.9% |
| Nov. | 762,668,283 | 570,457,632 | -5.6% | 9.4% |
| Dec. | 805,616,468 | 618,500,287 | -4.2% | 9.3% |
| Total of Jan. to Dec | 9,534,472,779 | 6,070,685,612 | -0.5% | 5.6% |
From Jan. to Dec. 2014, Chinese Processed Monumental or Building Stone and Articles Thereof accumulative total export volume was about 9.53 million tons, the export value was 6.07 billion US dollars. The export volume declined 0.5% year-on-year (YOY), the export value increased 5.6% year-on-year (YOY).
China Processed Monumental or Building Stone and Articles Thereof Major Export Countries/Regions Distribution, from Jan. to Dec. 2014
| No. | Country/Region | Volume (KG) | Value (USD) | Compared to the Same Period of 2013 | |
| Volume | Value | ||||
| 1 | Korea | 1,999,181,416 | 851,673,364 | 1.1% | 2.4% |
| 2 | Japan | 820,422,517 | 659,077,562 | -10.4% | -9.4% |
| 3 | USA | 555,587,117 | 620,558,498 | 2.3% | 0.1% |
| 4 | Germany | 629,152,334 | 216,696,576 | 28.3% | 18.5% |
| 5 | Viet Nam | 472,128,122 | 213,895,136 | 2.1% | 19.5% |
| 6 | Saudi Arabia | 277,056,736 | 171,378,738 | -26.9% | -15.2% |
| 7 | Malaysia | 117,429,441 | 167,847,363 | 18.1% | 41.3% |
| 8 | Hong Kong | 187,411,907 | 167,525,035 | -7.9% | -19.8% |
| 9 | United Arab Emirates | 214,392,115 | 164,611,760 | 10.5% | 20.2% |
| 10 | Iran | 164,307,993 | 159,508,819 | 28.6% | 62.8% |
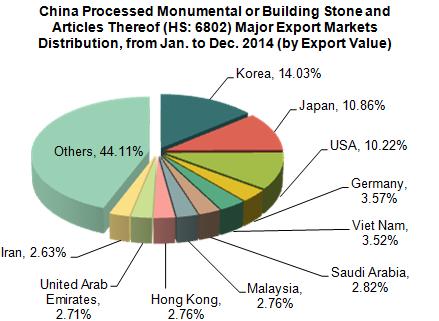
Korea was China major Processed Monumental or Building Stone and Articles Thereof largest export markets, from Jan. to Dec. 2014, the export value to Korea was 8.52 billion US dollars, which increased 2.4% year-on-year (YOY) and accounted for 14.03% of the total. Followed by Japan, the market share was 10.86%.
China Processed Monumental or Building Stone and Articles Thereof Original Places of Exported Goods, from Jan. to Dec. 2014
| No. | Region | Volume (KG) | Value (USD) | Compared to the Same Period of 2013 | |
| Volume | Value | ||||
| 1 | Fujian | 5,479,182,163 | 3,067,111,506 | -7% | -1.5% |
| 2 | Guangdong | 749,625,293 | 1,379,859,793 | 10.3% | 16.1% |
| 3 | Jiangxi | 409,314,228 | 409,295,114 | -0.4% | 26.3% |
| 4 | Shandong | 1,769,388,408 | 388,451,181 | 13.7% | 14.8% |
| 5 | Xinjiang Uygur Autonomous Region | 72,381,793 | 119,111,972 | 11.9% | -1.3% |
| 6 | Jiangsu | 158,254,073 | 106,268,349 | 11.5% | 21.6% |
| 7 | Hebei | 174,768,295 | 102,234,258 | 5.7% | 14.2% |
| 8 | Zhejiang | 60,093,187 | 101,508,260 | 47.3% | 78.3% |
| 9 | Hubei | 196,407,726 | 63,359,255 | 18.2% | 40.3% |
| 10 | Sichuan | 34,943,392 | 44,752,617 | -6% | -12% |
From Jan. to Dec.2014, the Chinese Processed Monumental or Building Stone and Articles Thereof original places of exported goods were Fujian, Guangdong, Jiangxi and Shandong. Among the four provinces, the total export volume accounted for 88.18% of the total of Chinese export volume, the export value accounted for 86.39% of the total export value.


