China Microwave Ovens (HS: 851650) Export Situation in 2013
China Microwave Ovens (HS: 851650) Export Volume and Value from Jan. to May in 2013
| Month | Volume (Pieces) | Value (USD) | Year on Year | |
| Volume | Value | |||
| January | 4,466,095 | 208,747,975 | 22.5% | 18.3% |
| February | 3,368,732 | 160,511,953 | 0.1% | -1.9% |
| March | 4,668,808 | 223,800,497 | -2.1% | -2.1% |
| April | 4,511,943 | 211,414,115 | 1.8% | -1.2% |
| May | 4,766,185 | 231,283,468 | 2.6% | 1.6% |
| Jan.-May Total | 21,781,763 | 1,035,758,008 | 4.4% | 2.5% |
China Microwave Ovens export value amounted to 1.04 billion U.S. dollars from Jan. to May in 2013, with an increase of 2.5%.
China Microwave Ovens (HS: 851650) Main Export Countries/Regions Distribution from Jan. to May in 2013
| No. | Country/Region | Volume (Pieces) | Value (USD) | Year on Year | |
| Volume | Value | ||||
| 1 | USA | 5,451,452 | 306,262,072 | -5.1% | -3.0% |
| 2 | Japan | 1,264,263 | 96,129,698 | 7.9% | -2.8% |
| 3 | Brazil | 2,222,391 | 78,554,109 | -13.3% | -15.7% |
| 4 | UK | 1,512,563 | 61,770,666 | 35.0% | 27.1% |
| 5 | The Russian Federation | 1,016,633 | 39,531,877 | 0.6% | 0.2% |
| 6 | France | 808,446 | 36,293,649 | 7.1% | 0.5% |
| 7 | Germany | 717,533 | 35,647,503 | -2.9% | -2.7% |
| 8 | Canada | 649,171 | 35,337,742 | 30.1% | 28.5% |
| 9 | Mexico | 681,809 | 30,311,878 | 13.4% | 7.2% |
| 10 | Spain | 534,917 | 20,773,110 | 10.8% | 12.9% |
| 11 | Australia | 353,899 | 18,981,514 | -7.2% | -9.2% |
| 12 | South Africa | 416,199 | 16,282,848 | 35.4% | 24.4% |
| 13 | Argentina | 307,529 | 13,601,123 | -4.0% | 0.7% |
| 14 | Italy | 283,674 | 13,188,649 | 3.1% | 7.6% |
| 15 | Republic of Korea | 314,819 | 13,147,556 | 10.5% | 9.8% |
| 16 | Turkey | 342,085 | 11,751,489 | -7.4% | -2.9% |
| 17 | Saudi Arabia | 215,965 | 10,643,139 | 54.9% | 41.4% |
| 18 | Chile | 242,924 | 10,127,115 | 27.4% | 31.2% |
| 19 | India | 187,405 | 8,881,964 | -5.6% | -7.0% |
| 20 | UAE | 196,877 | 8,833,989 | 15.0% | 9.9% |
Export Market Distribution (By Export Value)
USA, Japan, Brazil, UK, The Russian Federation, France, Germany, Canada, Mexico, Spain, others
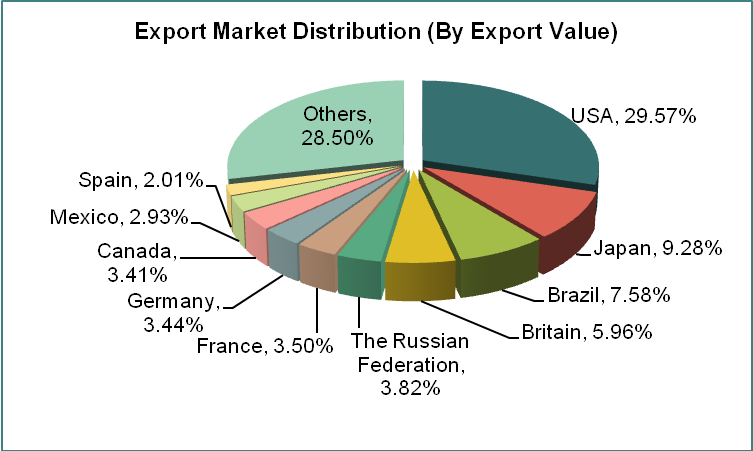
China Microwave Ovens main export countries / regions are the United States, Japan, Brazil, Britain, Russia, France, Germany, Canada, Mexico and Spain from Jan. to May in 2013.
China Microwave Ovens (HS: 851650) Main Export Source Area from Jan. to May in 2013
| No. | Region | Volume (Pieces) | Value (USD) | Year on Year | |
| Volume | Value | ||||
| 1 | Guangdong | 16,377,619 | 704,195,873 | 4.7% | 5.6% |
| 2 | Tianjin | 3,905,457 | 198,335,901 | 7.0% | -2.4% |
| 3 | Shanghai | 1,462,150 | 131,758,082 | -6.5% | -5.7% |
| 4 | Anhui | 32,729 | 1,130,307 | 12250.6% | 2921.6% |
| 5 | Zhejiang | 3,193 | 297,492 | 31.8% | -11.8% |
Guangdong, Tianjin and Shanghai are our Microwave Ovens main export source area. There was the largest increase of both export volume and value in Anhui Province, with an increase of 12250.6% year on year of export volume and 2921.6% year on year of export value.
China Ovens; Cookers, Cooking Plates, Boiling Rings, Grillers and Roasters (HS: 851660) Export Volume and Value from Jan. to May in 2013
| Month | Volume (Pieces) | Value (USD) | Year on Year | |
| Volume | Value | |||
| January | 17,642,661 | 313,322,382 | 33.2% | 43.9% |
| February | 10,869,474 | 201,901,386 | 46.6% | 56.8% |
| March | 13,287,414 | 252,506,658 | 2.1% | 15.3% |
| April | 15,675,718 | 288,789,765 | 22.4% | 33.1% |
| May | 17,043,006 | 321,926,026 | 17.7% | 35.8% |
| Jan.-May Total | 74,518,273 | 1,378,446,217 | 22.2% | 35.2% |
China Ovens; Cookers, Cooking Plates, Boiling Rings, Grillers and Roasters (HS: 851660) Main Export Countries/Regions Distribution from Jan. to May in 2013
| No. | Country/Region | Volume (Pieces) | Value (USD) | Year on Year | |
| Volume | Value | ||||
| 1 | USA | 13,321,229 | 224,348,427 | 11.9% | 16.4% |
| 2 | The Russian Federation | 9,005,071 | 215,384,092 | 553.4% | 757.4% |
| 3 | Japan | 3,972,868 | 109,591,642 | 2.8% | 10.6% |
| 4 | India | 6,294,318 | 83,529,376 | 55.4% | 48.1% |
| 5 | Brazil | 3,093,168 | 45,016,602 | -5.9% | 1.8% |
| 6 | Germany | 1,897,675 | 38,131,399 | 6.0% | 5.5% |
| 7 | Netherlands | 2,152,875 | 37,802,191 | 4.5% | 11.7% |
| 8 | France | 1,644,882 | 35,724,491 | 7.0% | 4.0% |
| 9 | Australia | 1,392,484 | 32,223,940 | 6.8% | 3.0% |
| 10 | Indonesia | 2,308,212 | 31,977,964 | -5.7% | -9.3% |
| 11 | UK | 1,445,134 | 30,692,415 | 22.5% | 34.3% |
| 12 | Republic of Korea | 1,473,318 | 27,217,909 | 42.5% | 50.3% |
| 13 | Hong Kong | 637,132 | 26,499,615 | 17.1% | 112.8% |
| 14 | UAE | 1,617,769 | 25,897,170 | 34.4% | 50.8% |
| 15 | Venezuela | 205,130 | 25,014,305 | -51.3% | 73.4% |
| 16 | Thailand | 2,246,694 | 24,430,508 | 4.8% | 6.0% |
| 17 | South Africa | 1,743,185 | 21,484,586 | -12.8% | -3.6% |
| 18 | Vietnam | 1,131,990 | 18,337,846 | 9.0% | 4.8% |
| 19 | Spain | 984,924 | 17,844,879 | -21.1% | -23.7% |
| 20 | Malaysia | 982,435 | 17,120,489 | -4.2% | -14.2% |
Export Market Distribution (By Export Value)
USA, The Russian Federation, Japan, India, Brazil, Germany, Netherlands, France, Australia, Indonesia, others
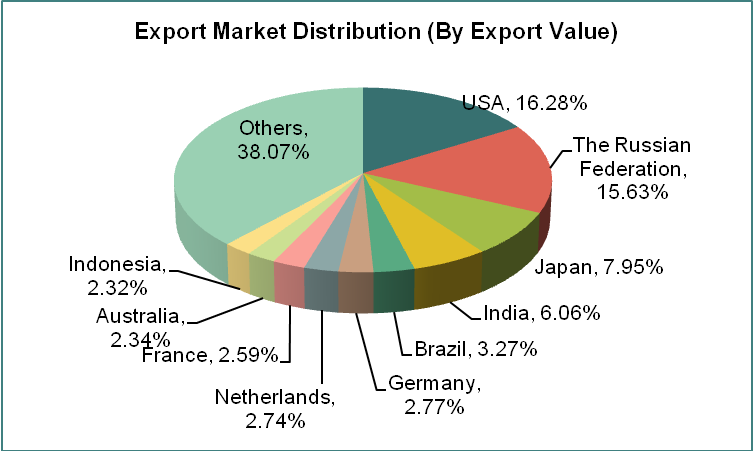
China Ovens; Cookers, Cooking Plates, Boiling Rings, Grillers and Roasters main export countries / regions are the United States, the Russian Federation, Japan, India, Brazil, Germany, Netherlands, France, Australia, Indonesia and so on from Jan. to May in 2013.Among the above twenty exporting countries/regions, there is a larger increase of export value in The Russian Federation (with an increase of 757.4% year on year) and Hong Kong (with an increase of 112.8% year on year).
China Ovens; Cookers, Cooking Plates, Boiling Rings, Grillers and Roasters (HS: 851660) Main Export Source Area from Jan. to May in 2013
| No. | Region | Volume (Pieces) | Value (USD) | Year on Year | |
| Volume | Value | ||||
| 1 | Guangdong | 53,522,822 | 1,006,850,151 | 24.9% | 37.6% |
| 2 | Zhejiang | 15,358,891 | 229,257,050 | 13.8% | 23.6% |
| 3 | Fujian | 1,855,328 | 41,249,071 | -13.8% | -5.3% |
| 4 | Shanghai | 1,235,920 | 35,691,889 | 183.5% | 139.4% |
| 5 | Jiangsu | 2,287,065 | 35,410,832 | 26.7% | 35.7% |
Guangdong and Zhejiang are our Ovens; Cookers, Cooking Plates, Boiling Rings, Grillers and Roasters main export source area. There was the largest increase of both export volume and value in Shanghai Province, with an increase of 183.5% year on year of export volume and 139.4% year on year of export value.
China Coffee or Tea Makers (HS: 851671) Export Volume and Value from Jan. to May in 2013
| Month | Volume (Pieces) | Value (USD) | Year on Year | |
| Volume | Value | |||
| January | 12,087,620 | 196,637,195 | 4.7% | 23.5% |
| February | 7,346,445 | 121,290,494 | 17.0% | 18.6% |
| March | 8,704,232 | 157,680,596 | -18.0% | -3.9% |
| April | 11,327,812 | 184,194,581 | 0.4% | 8.8% |
| May | 11,163,789 | 179,652,335 | -1.5% | 6.3% |
| Jan.-May Total | 50,629,898 | 839,455,201 | -0.8% | 9.9% |
China Coffee or Tea Makers export value amounted to approximately 0.84 billion U.S. dollars from Jan. to May in 2013, with an increase of 9.9%.
China Coffee or Tea Makers (HS: 851671) Main Export Countries/Regions Distribution from Jan. to May in 2013
| No. | Country/Region | Volume (Pieces) | Value (USD) | Year on Year | |
| Volume | Value | ||||
| 1 | USA | 12,210,715 | 253,100,117 | -11.0% | -2.3% |
| 2 | Germany | 4,493,907 | 121,929,972 | 16.4% | 50.7% |
| 3 | UK | 2,649,028 | 35,935,151 | 3.9% | 5.3% |
| 4 | Australia | 1,269,556 | 32,640,389 | 11.5% | 16.4% |
| 5 | France | 1,965,528 | 30,642,751 | -5.3% | -10.8% |
| 6 | Italy | 760,453 | 29,995,589 | 5.3% | 16.9% |
| 7 | Canada | 1,302,462 | 28,343,226 | -30.6% | -26.4% |
| 8 | Hong Kong | 1,156,386 | 28,247,360 | -15.6% | 45.4% |
| 9 | Brazil | 2,159,993 | 28,203,052 | 34.0% | 83.1% |
| 10 | Japan | 1,810,096 | 25,977,256 | 4.5% | 20.0% |
| 11 | Netherlands | 1,846,343 | 22,038,490 | -5.5% | -12.1% |
| 12 | Spain | 777,635 | 17,713,690 | 13.5% | 47.9% |
| 13 | The Russian Federation | 1,730,561 | 16,338,651 | -2.4% | -13.0% |
| 14 | Turkey | 1,289,817 | 13,686,490 | 92.3% | 91.9% |
| 15 | Republic of Korea | 1,088,718 | 9,990,790 | 7.2% | -2.4% |
| 16 | Switzerland | 236,992 | 9,061,103 | -26.8% | -6.8% |
| 17 | South Africa | 1,482,288 | 8,826,306 | -7.8% | -5.8% |
| 18 | Mexico | 628,653 | 8,443,538 | -10.9% | 8.9% |
| 19 | Sweden | 530,433 | 8,371,061 | 13.5% | 18.5% |
| 20 | UAE | 906,805 | 8,209,501 | 27.2% | 32.8% |
Export Market Distribution (By Export Value)
USA, Germany, UK, Australia, France, Italy, Canada, Hong Kong, Brazil, Japan, others
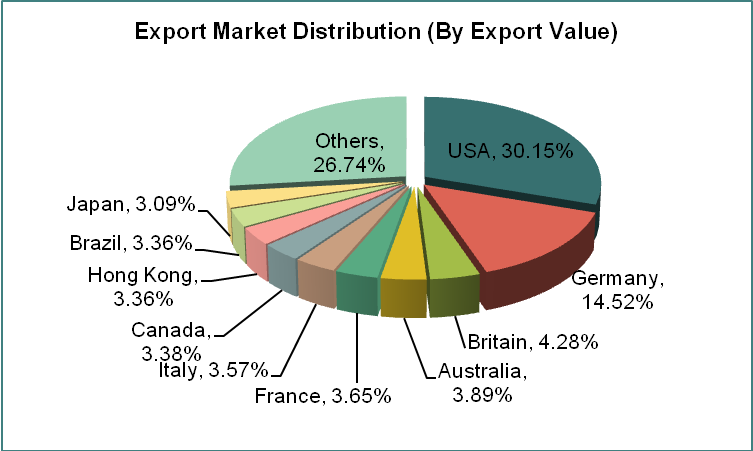
China Coffee or Tea Makers main export countries / regions are the United States, Germany, Britain, Australia, France, Italy, Canada, Hong Kong, Brazil and Japan from Jan. to May in 2013.
China Coffee or Tea Makers (HS: 851671) Main Export Source Area from Jan. to May in 2013
| No. | Region | Volume (Pieces) | Value (USD) | Year on Year | |
| Volume | Value | ||||
| 1 | Guangdong | 31,280,278 | 615,244,152 | -12.7% | 1.4% |
| 2 | Zhejiang | 16,149,149 | 129,064,606 | 20.6% | 30.3% |
| 3 | Jiangsu | 2,286,396 | 70,836,994 | 83.9% | 104.4% |
| 4 | Shanghai | 375,777 | 9,935,405 | 176.8% | 19.1% |
| 5 | Fujian | 259,975 | 9,841,020 | -31.8% | -32.2% |
Guangdong and Zhejiang are our Coffee or Tea Makers main export source area.
China Toasters (HS: 851672) Export Situation in 2013
China Toasters (HS: 851672) Export Volume and Value from Jan. to May in 2013
| Month | Volume (Pieces) | Value (USD) | Year on Year | |
| Volume | Value | |||
| January | 7,370,383 | 78,390,767 | -8.8% | -3.4% |
| February | 4,926,817 | 51,364,367 | 31.4% | 10.4% |
| March | 5,560,635 | 61,492,664 | -25.1% | -20.1% |
| April | 7,045,957 | 78,944,276 | -3.8% | -0.9% |
| May | 7,823,056 | 79,390,527 | -3.3% | -6.2% |
| Jan.-May Total | 32,726,848 | 349,582,601 | -5.6% | -5.2% |
China Toasters export value amounted to 0.35 billion U.S. dollars from Jan. to May in 2013, with a decrease of 5.2%.
China Toasters (HS: 851672) Main Export Countries/Regions Distribution from Jan. to May in 2013
| No. | Country/Region | Volume (Pieces) | Value (USD) | Year on Year | |
| Volume | Value | ||||
| 1 | USA | 7,111,914 | 74,296,846 | -13.2% | -8.2% |
| 2 | UK | 2,823,829 | 34,656,530 | 5.0% | 8.5% |
| 3 | Japan | 1,002,743 | 33,408,932 | -28.1% | -23.3% |
| 4 | Germany | 1,896,661 | 21,013,135 | 4.9% | 14.2% |
| 5 | Brazil | 3,546,794 | 20,858,707 | 1.1% | -8.6% |
| 6 | The Russian Federation | 692,758 | 15,975,308 | 11.4% | -13.4% |
| 7 | Australia | 1,107,108 | 13,820,028 | 0.7% | -4.0% |
| 8 | Netherlands | 1,613,761 | 13,364,507 | -2.4% | 0.4% |
| 9 | France | 995,297 | 10,769,476 | -17.5% | -9.8% |
| 10 | Canada | 817,563 | 10,021,502 | -12.5% | -7.9% |
| 11 | Italy | 567,736 | 7,556,511 | -2.9% | 18.7% |
| 12 | Spain | 806,086 | 5,906,849 | 0.8% | -3.6% |
| 13 | Belgium | 352,223 | 5,547,692 | 9.9% | 47.2% |
| 14 | Hong Kong | 224,060 | 4,357,731 | -16.9% | 56.0% |
| 15 | Ukraine | 220,865 | 4,141,171 | 30.8% | 1.7% |
| 16 | Mexico | 544,049 | 3,956,223 | -15.4% | -3.4% |
| 17 | Turkey | 456,877 | 3,854,653 | 94.8% | 16.2% |
| 18 | UAE | 383,368 | 3,791,194 | -11.1% | -10.0% |
| 19 | India | 657,007 | 3,780,682 | 16.3% | 9.3% |
| 20 | South Africa | 459,492 | 3,719,896 | -3.2% | -0.7% |
Export Market Distribution (By Export Value)
USA, UK, Japan, Germany, Brazil, The Russian Federation, Australia, Netherlands, France, Canada, others
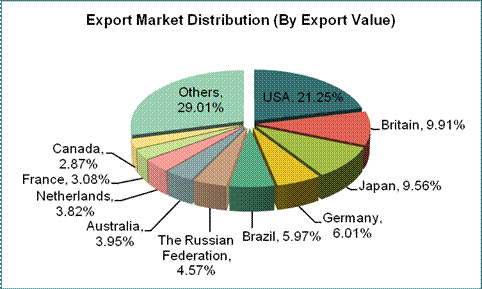
China Toasters main export countries / regions are the United States, Britain, Japan, Germany, Brazil, Russian Federation, Australia, the Netherlands, France and Canada and so on from Jan. to May in 2013.
China Toasters (HS: 851672) Main Export Source Area from Jan. to May in 2013
| No. | Region | Volume (Pieces) | Value (USD) | Year on Year | |
| Volume | Value | ||||
| 1 | Guangdong | 12,212,068 | 157,612,693 | -13.1% | -12.7% |
| 2 | Zhejiang | 17,253,383 | 123,912,154 | 5.7% | 8.0% |
| 3 | Fujian | 3,155,259 | 66,582,416 | -24.8% | -8.3% |
| 4 | Shanghai | 90,594 | 929,487 | 5.2% | 16.5% |
| 5 | Jiangsu | 2,803 | 461,260 | 80.4% | 64.7% |
Guangdong and Zhejiang are our Toasters main export source area.
China Other Electro-thermic Appliances (HS: 851679) Export Situation in 2013
China Other Electro-thermic Appliances (HS: 851679) Export Volume and Value from Jan. to May in 2013
| Month | Volume (Sets) | Value (USD) | Year on Year | |
| Volume | Value | |||
| January | 26,469,543 | 198,150,065 | -0.6% | 22.9% |
| February | 25,806,896 | 136,484,538 | 84.6% | 41.4% |
| March | 28,308,959 | 173,272,257 | 3.2% | 2.2% |
| April | 32,785,146 | 202,634,770 | 15.1% | 14.8% |
| May | 31,892,858 | 210,924,223 | 17.9% | 22.2% |
| Jan.-May Total | 145,263,402 | 921,465,853 | 17.5% | 18.7% |
China Other Electro-thermic Appliances export value amounted to 0.92 billion U.S. dollars from Jan. to May in 2013, with a decrease of 18.7%.
China Other Electro-thermic Appliances (HS: 851679) Main Export Countries/Regions Distribution from Jan. to May in 2013
| No. | Country/Region | Volume (Sets) | Value (USD) | Year on Year | |
| Volume | Value | ||||
| 1 | USA | 27,563,047 | 157,458,482 | 24.2% | 6.3% |
| 2 | Japan | 4,487,834 | 92,314,379 | -14.6% | -4.4% |
| 3 | UK | 5,408,329 | 65,902,452 | 34.5% | 41.7% |
| 4 | Germany | 2,789,022 | 49,651,151 | 23.9% | 65.2% |
| 5 | The Russian Federation | 8,124,482 | 46,406,291 | 97.1% | 59.0% |
| 6 | France | 2,049,800 | 41,621,047 | 59.3% | 80.2% |
| 7 | Canada | 2,020,694 | 35,773,232 | 153.2% | 124.0% |
| 8 | Australia | 2,131,584 | 28,116,646 | 9.2% | 14.1% |
| 9 | Turkey | 2,884,936 | 27,550,766 | 19.8% | -8.7% |
| 10 | UAE | 2,120,974 | 21,679,884 | 12.8% | 12.2% |
| 11 | Hong Kong | 4,866,501 | 19,158,008 | 26.8% | -0.6% |
| 12 | Brazil | 5,856,495 | 17,617,274 | 76.7% | 6.3% |
| 13 | Republic of Korea | 2,658,423 | 16,794,589 | 18.8% | 41.3% |
| 14 | Netherlands | 1,383,101 | 16,236,713 | -0.9% | 3.7% |
| 15 | Saudi Arabia | 983,455 | 14,890,530 | 41.8% | 2.7% |
| 16 | Spain | 3,777,101 | 14,134,400 | -13.2% | 48.9% |
| 17 | Italy | 7,375,849 | 13,005,790 | -4.4% | 20.3% |
| 18 | Iraq | 250,756 | 12,918,180 | 28.9% | 60.4% |
| 19 | Belgium | 494,174 | 11,830,915 | 43.0% | 120.6% |
| 20 | Philippines | 1,272,018 | 11,802,052 | -12.7% | -7.3% |
Export Market Distribution (By Export Value)
USA, Japan, UK, Germany, The Russian Federation, France, Canada, Australia, Turkey, UAE, others
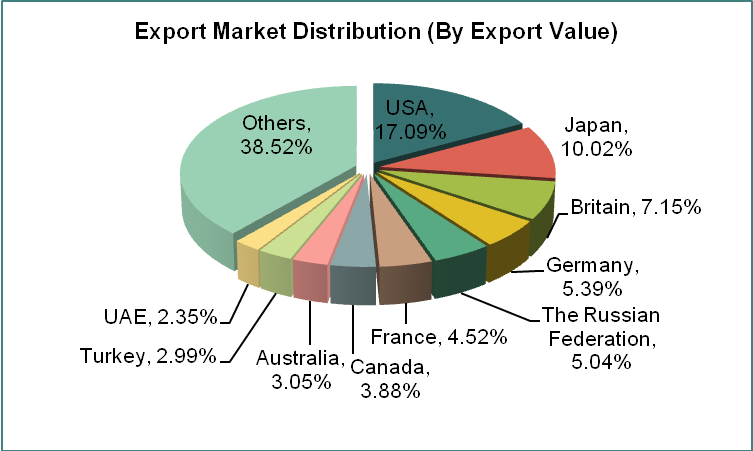
China Other Electro-thermic Appliances main export countries / regions are the United States, Japan, Britain, Germany, Russia, France, Canada, Australia, Turkey and the UAE and so on from Jan. to May in 2013.
Among the above twenty exporting countries/regions, there is a larger increase of export value in Canada (with an increase of 124.0% year on year) and Belgium (with an increase of 120.6% year on year).
China Other Electro-thermic Appliances (HS: 851679) Main Export Source Area from Jan. to May in 2013
| No. | Region | Volume (Sets) | Value (USD) | Year on Year | |
| Volume | Value | ||||
| 1 | Guangdong | 113,224,265 | 537,757,085 | 16.9% | 21.2% |
| 2 | Zhejiang | 23,228,677 | 253,123,823 | 25.1% | 13.7% |
| 3 | Jiangsu | 5,545,678 | 81,228,300 | 65.6% | 45.3% |
| 4 | Shanghai | 981,829 | 24,437,291 | -21.6% | -20.2% |
| 5 | Shandong | 18,612 | 7,270,452 | 3.3% | 31.7% |
Guangdong and Zhejiang are our Other Electro-thermic Appliances main export source area.


