Japanese Imports of Seats and Parts (HS: 9401) from Jan. to Apr. in 2013
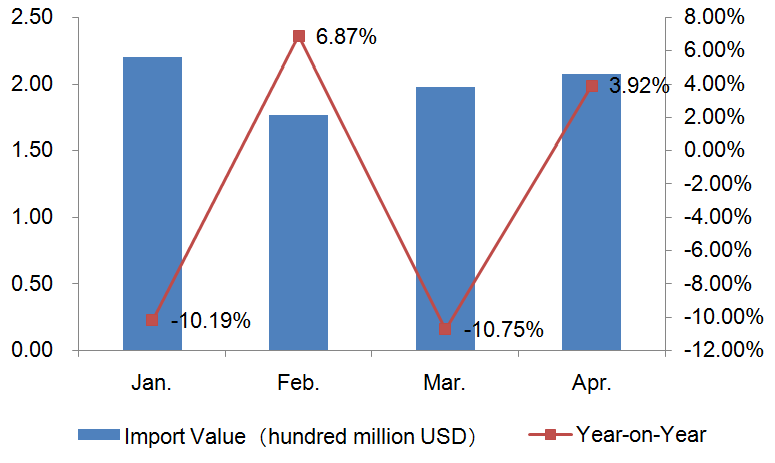
Japanese Imports Value of Seats and Parts from Jan. to Apr. in 2013

| Month | Amount (Hundred Million Dollars) | Year on Year |
| January | 2.20 | -10.19% |
| February | 1.77 | 6.87% |
| March | 1.98 | -10.75% |
| April | 2.08 | 3.92% |
| Total | 8.02 | -3.55% |
Japanese imports of seats and parts cumulatively amounted to $ 802 million from Jan. to Apr. in 2013, decreased by 3.55% year on year.
The Major Origin Countries / Regions of Japanese Seats and Parts Imports from Jan. to Apr. in 2013 (Unit: Thousand Dollars)
| Countries/Regions | Amount | Year on Year |
| China | 483,557 | -5.24% |
| Mexico | 49,292 | -28.52% |
| Thailand | 43,241 | 11.20% |
| Vietnam | 35,380 | 1.55% |
| Taiwan | 33,619 | -1.26% |
| Italy | 20,229 | 16.78% |
| Germany | 19,128 | 23.84% |
| Indonesia | 19,067 | 11.54% |
| USA | 13,809 | -15.58% |
| United Kingdom | 13,237 | 47.55% |
| Malaysia | 12,921 | -4.06% |
| France | 12,652 | 49.67% |
| Korea | 8,303 | 74.80% |
| Denmark | 5,818 | -9.48% |
| Norway | 4,703 | 6.07% |
| Canada | 4,340 | -58.10% |
| Philippine | 2,972 | -34.28% |
| South Africa | 1,971 | 1.03% |
| Spain | 1,883 | 124.43% |
| India | 1,772 | 735.85% |
Among the top ten import origin countries / regions, the largest increase of value was in India (increased by 735.85%) from Jan. to Apr. in 2013, followed by Spain (increased by 124.43%). China is the major origin country for Japanese seats and parts imports and the imports value was $ 484 million from Jan. to Apr. in 2013.
Japanese Imports of Other Furniture and Parts (HS: 9403) from Jan. to Apr. in 2013
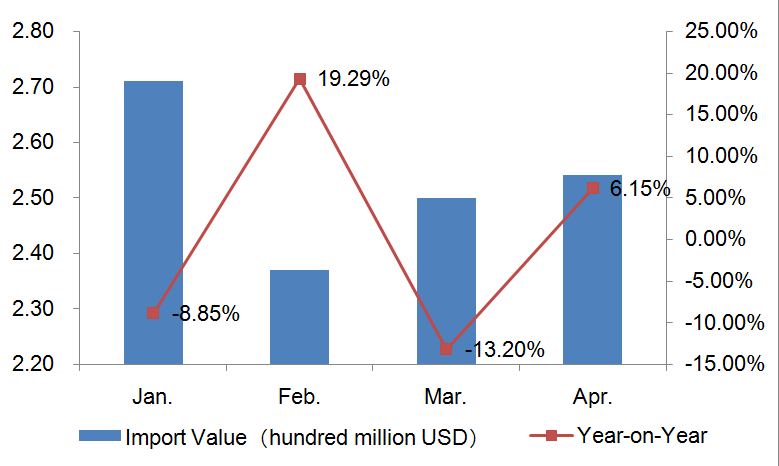
Japanese Imports Value of Other Furniture and Parts from Jan. to Apr. in 2013

| Month | Amount (Hundred Million Dollars) | Year on Year |
| January | 2.71 | -8.85% |
| February | 2.37 | 19.29% |
| March | 2.50 | -13.20% |
| April | 2.54 | 6.15% |
| Total | 10.13 | -1.10% |
Japanese imports of other furniture and parts cumulatively amounted to $ 1.013 billion from Jan. to Apr. in 2013, decreased by 1.10% year on year.
The Major Origin Countries / Regions of Japanese Other Furniture and Parts Imports from Jan. to Apr. in 2013 (Unit: Thousand Dollars)
| Countries/Regions | Amount | Year on Year |
| China | 486,320 | -0.80% |
| Vietnam | 128,058 | 5.06% |
| Taiwan | 82,555 | 4.92% |
| Malaysia | 70,153 | -14.51% |
| Indonesia | 64,421 | -15.19% |
| Thailand | 38,090 | -8.69% |
| Philippine | 31,582 | 35.27% |
| Austria | 25,898 | 15.27% |
| Italy | 17,855 | 3.36% |
| Germany | 12,842 | -0.48% |
| USA | 9,677 | -19.03% |
| Korea | 7,929 | 8.56% |
| Poland | 6,813 | -20.05% |
| United Kingdom | 3,807 | -8.24% |
| Turkey | 3,703 | 59.06% |
| France | 3,513 | 86.37% |
| Denmark | 3,064 | -16.26% |
| Portugal | 2,279 | -19.78% |
| Sweden | 2,247 | -2.94% |
| Swiss | 1,760 | 23.08% |
Among the top ten import origin countries / regions, the largest increase of value was in France (increased by 86.37%) from Jan. to Apr. in 2013, followed by Turkey (increased by 59.06%). China is the major origin country for Japanese seats and parts imports and the imports value was $ 486 million from Jan. to Apr. in 2013.
Japanese Imports of Spring Mattress, Bedding and Similar Products (HS: 9404) from Jan. to Apr. in 2013
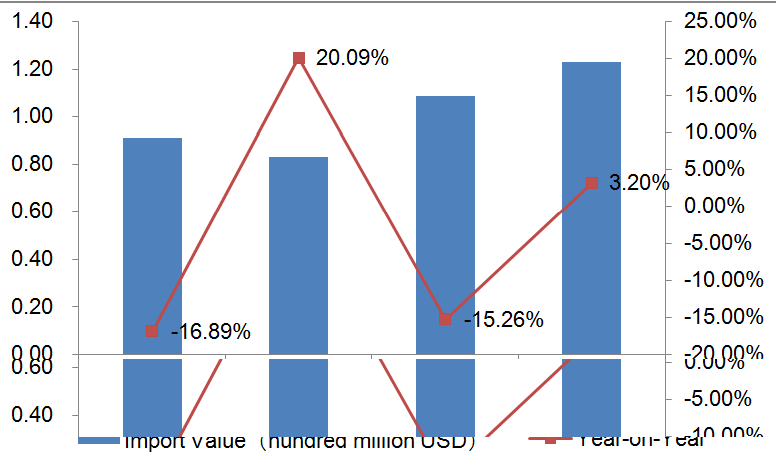
Japanese Imports Value of Spring Mattress, Bedding and Similar Products from Jan. to Apr. in 2013

| Month | Amount (Hundred Million Dollars) | Year on Year |
| January | 0.91 | -16.89% |
| February | 0.83 | 20.09% |
| March | 1.09 | -15.26% |
| April | 1.23 | 3.20% |
| Total | 4.06 | -4.81% |
Japanese imports of spring mattress, bedding and similar products cumulatively amounted to $ 406 million from Jan. to Apr. in 2013, decreased by 4.81% year on year.
The Major Origin Countries / Regions of Japanese Spring Mattress, Bedding and Similar Products Imports from Jan. to Apr. in 2013 (Unit: Thousand Dollars)
| Countries/Regions | Amount | Year on Year |
| China | 347,533 | -6.60% |
| Vietnam | 11,281 | 22.35% |
| Italy | 9,743 | 3.19% |
| Denmark | 9,008 | 16.56% |
| USA | 7,905 | -3.01% |
| Germany | 3,315 | -3.01% |
| Malaysia | 3,292 | -4.25% |
| Taiwan | 3,231 | -2.42% |
| Thailand | 2,100 | 28.60% |
| Canada | 1,322 | -12.22% |
| Canada | 1,079 | 17.67% |
| Brazil | 825 | 3337.50% |
| Korea | 788 | -50.87% |
| Estonia | 692 | 72.57% |
| Turkey | 687 | 5184.62% |
| Swiss | 548 | -0.72% |
| Indonesia | 343 | 61.03% |
| Poland | 334 | -56.23% |
| Norway | 284 | 628.21% |
| Austria | 255 | 14.86% |
Among the top ten import origin countries / regions, the largest increase of value was in Turkey (increased by 5184.62%) from Jan. to Apr. in 2013, followed by Brazil (increased by 3337.50%). China is the major origin country for Japanese spring mattress, bedding and similar products imports and the imports value was $ 348 million from Jan. to Apr. in 2013.
Source: UN COMTRADE


