China Processed Slate Export Volume and Value, from Jan. to Dec. 2014
| Month | Volume (KG) | Value (USD) | Compared to the Same Period of 2013 | |
| Volume | Value | |||
| Jan. | 47,411,817 | 20,742,528 | 56.1% | 85.9% |
| Feb. | 8,689,656 | 3,925,281 | -64.6% | -59% |
| Mar. | 23,199,925 | 9,411,617 | 37.1% | 48.9% |
| Apr. | 41,199,042 | 16,551,733 | 2.1% | 7.1% |
| May | 41,021,345 | 16,422,759 | -19.9% | -13.8% |
| Jun. | 39,658,696 | 16,315,980 | 10.2% | 11.8% |
| Jul. | 43,552,059 | 18,399,496 | 3.1% | 14.2% |
| Aug. | 44,428,276 | 18,333,606 | -5.3% | -1.3% |
| Sep. | 37,304,994 | 15,606,083 | 9.1% | 14.4% |
| Oct. | 32,232,133 | 13,855,558 | -6.4% | -12.9% |
| Nov. | 31,765,313 | 13,140,599 | -5.3% | -5% |
| Dec. | 47,370,342 | 19,905,919 | 39% | 36.4% |
| Total of Jan. to Dec | 437,833,598 | 182,611,159 | 3.1% | 8.2% |
From Jan. to Dec. 2014, Chinese Processed Slate accumulative total export volume was about 43.78 ten thousand tons, the export value was 1.83 billion US dollars. The export volume increased 3.1% year-on-year (YOY), the export value increased 8.2% year-on-year (YOY).
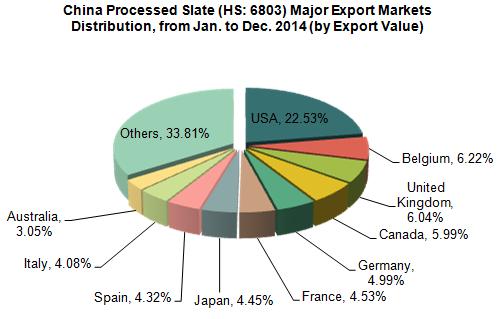
China Processed Slate Major Export Countries/Regions Distribution, from Jan. to Dec. 2014
| No. | Country | Volume (KG) | Value (USD) | Compared to the Same Period of 2013 | |
| Volume | Value | ||||
| 1 | USA | 87,081,446 | 41,140,966 | 1.4% | -0.2% |
| 2 | Belgium | 24,953,466 | 11,354,423 | 66.7% | 89.1% |
| 3 | United Kingdom | 27,586,090 | 11,026,609 | 29.2% | 24.6% |
| 4 | Canada | 28,473,179 | 10,940,105 | -10.3% | -7.5% |
| 5 | Germany | 22,938,428 | 9,114,583 | -1% | 5.7% |
| 6 | France | 20,242,489 | 8,273,189 | 12.8% | 15.7% |
| 7 | Japan | 14,053,747 | 8,121,735 | -30.7% | -6.2% |
| 8 | Spain | 20,746,145 | 7,891,712 | 12.1% | 26% |
| 9 | Italy | 18,384,433 | 7,446,360 | -0.3% | -3.1% |
| 10 | Australia | 14,105,626 | 5,566,357 | 4.4% | 9.2% |

USA was China major Processed Slate largest export markets, from Jan. to Dec. 2014, the export value to USA was 4114.1 ten thousand US dollars, which declined 0.2% year-on-year (YOY) and accounted for 22.53% of the total. Followed by Belgium, the market share was 6.22%.
China Processed Slate Original Places of Exported Goods, from Jan. to Dec. 2014
| No. | Region | Volume (KG) | Value (USD) | Compared to the Same Period of 2013 | |
| Volume | Value | ||||
| 1 | Hebei | 313,330,603 | 126,214,546 | 3.5% | 11% |
| 2 | Jiangxi | 51,982,474 | 20,168,339 | 10.5% | 17.7% |
| 3 | Guangdong | 3,419,785 | 8,149,673 | -3% | -19.7% |
| 4 | Tianjin | 17,983,788 | 6,210,484 | -3.2% | 5.8% |
| 5 | Hubei | 14,073,477 | 5,798,481 | 9.2% | 19.9% |
| 6 | Beijing | 14,759,930 | 4,674,505 | -30.9% | -23.4% |
| 7 | Shanxi | 8,103,194 | 3,431,519 | 17.6% | 7.3% |
| 8 | Zhejiang | 944,281 | 1,431,848 | -6.6% | -10.5% |
| 9 | Shandong | 2,993,182 | 1,338,822 | 53.1% | 71.4% |
| 10 | Liaoning | 1,989,385 | 1,015,532 | 28% | 35.9% |
From Jan. to Dec.2014, the Chinese Processed Slate original places of exported goods were Hebei and Jiangxi. The export volume of Hebei accounted for 71.56% of the total of Chinese export volume, the export value accounted for 69.12% of the total export value. The export volume of Jiangxi accounted for 11.87% of the total of Chinese export volume, the export value accounted for 11.04% of the total export value


