Medicine Export Volume and Sales Statistics, from Jan. to Dec. 2014
| Month | Volume (KG) | Value (USD) | Compared to The Same Period of Last Year | |
| Volume | Value | |||
| Jan. | 49,470,836 | 584,069,649 | 22% | 20.5% |
| Feb. | 24,604,492 | 374,162,067 | -18.3% | -13.4% |
| Mar. | 40,946,065 | 552,835,327 | 4.4% | 4.9% |
| Apr. | 48,558,058 | 551,991,941 | 10.3% | -1.7% |
| May | 48,823,661 | 555,749,619 | 3.3% | 3.8% |
| Jun. | 44,376,031 | 539,466,794 | 8.1% | 3.4% |
| Jul. | 48,208,068 | 574,416,042 | 2.7% | 3.6% |
| Aug. | 46,639,143 | 539,574,280 | 4.2% | 5.6% |
| Sep. | 42,737,564 | 593,403,647 | 4.1% | 15.9% |
| Oct. | 45,411,700 | 532,134,239 | 13.7% | 16.4% |
| Nov. | 45,983,434 | 559,266,607 | -0.5% | 0.4% |
| Dec. | 49,345,922 | 635,130,091 | 5.9% | 14.7% |
| Total | 535,111,227 | 6,592,338,851 | 5.3% | 6% |
The export volume of China Medicine from January to December of 2014 is 0.54 million tons, increased 5.3% compared to the same period of 2013, the export sales is 6.59 billion USD, increased 6% compared to the same period of 2013.
Major Export Countries/Regions for Medicine, from Jan. to Dec. 2014
| No. | County/Region | Volume (KG) | Value (USD) | Compared to The Same Period of Last Year | |
| Volume | Value | ||||
| 1 | United States | 72,053,819 | 1,161,859,154 | 4.5% | 11.4% |
| 2 | Australia | 9,727,119 | 579,120,527 | 12.2% | 0.6% |
| 3 | Republic of Korea | 7,404,773 | 336,842,326 | -1.4% | 9.6% |
| 4 | Hong Kong | 16,639,232 | 288,911,443 | 6.8% | 12.2% |
| 5 | Germany | 21,530,138 | 273,939,083 | 4.2% | -15.2% |
| 6 | Japan | 14,402,912 | 243,918,156 | 1.7% | -4.5% |
| 7 | India | 9,025,356 | 228,098,281 | 5.8% | 3.6% |
| 8 | France | 9,608,113 | 218,496,472 | 5.1% | -17.7% |
| 9 | United Kingdom | 14,135,041 | 212,757,519 | -0.5% | 16.3% |
| 10 | Netherlands | 9,452,086 | 144,353,016 | -0.7% | 62.7% |
| 11 | Brazil | 17,861,871 | 140,725,832 | 13.6% | 47.5% |
| 12 | Thailand | 9,764,818 | 131,570,691 | 13.7% | 95.4% |
| 13 | Nigeria | 16,834,222 | 126,189,890 | 15.3% | 9.9% |
| 14 | Italy | 7,680,633 | 113,331,138 | 4.3% | 6.1% |
| 15 | Malaysia | 7,806,425 | 104,332,147 | 15.1% | 2.5% |
| 16 | Canada | 6,068,428 | 95,041,634 | 5.9% | 13.7% |
| 17 | Palestine | 12,824,686 | 81,643,782 | 25.1% | 24.1% |
| 18 | Ireland | 1,088,577 | 69,816,738 | 34.8% | 55.5% |
| 19 | Philippines | 11,966,189 | 69,511,222 | 9.5% | 1.3% |
| 20 | Vietnam | 12,383,890 | 66,856,238 | -9.1% | 17% |

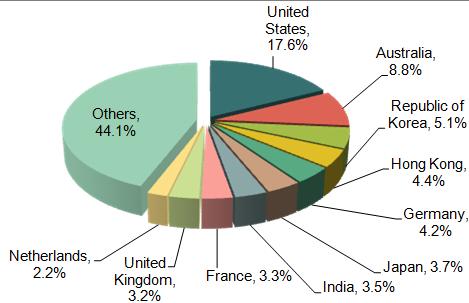
The top Countries China Export to of medicine is the United States, Australia, Republic of Korea, Hong Kong, Germany, Japan, India, France, United Kingdom, Netherlands and etc. The export sales to The United States accounted for 17.6% of total export sales of China.
Regions of Origin for Exported Medicine, from Jan. to Nov. 2014
| No. | Region | Volume (KG) | Value (USD) | Compared to The Same Period of Last Year | |
| Volume | Value | ||||
| 1 | Shanghai | 40,560,620 | 1,725,684,176 | -2.7% | 4.7% |
| 2 | Jiangsu | 85,661,212 | 1,051,720,801 | 2.8% | 3.5% |
| 3 | Shandong | 59,797,495 | 772,990,062 | 9.6% | 4.6% |
| 4 | Zhejiang | 86,148,063 | 723,099,086 | -0.6% | 4.2% |
| 5 | Guangdong | 39,983,692 | 597,371,332 | 4.1% | 6% |
| 6 | Hubei | 54,459,779 | 392,250,711 | 11.2% | 15.3% |
| 7 | Hebei | 71,781,228 | 329,500,529 | 17.3% | 9.5% |
| 8 | Tianjin | 6,784,942 | 159,195,992 | 28.3% | 0.8% |
| 9 | Beijing | 3,704,968 | 143,889,315 | -17.5% | 40.2% |
| 10 | Liaoning | 4,189,261 | 97,007,953 | 7.1% | 3.8% |

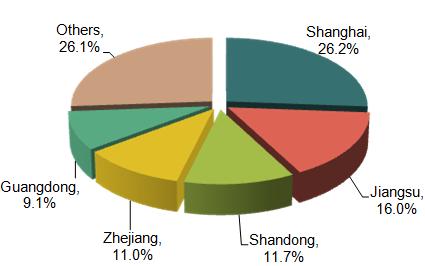
Shanghai, Shandong, Jiangsu, Zhejiang are the main original places of exported medicine from January to December of 2014, the export sales of the four cities accounted for 26.2%, 16.0%, 11.7%, and 11.0% in total.
Source: China Customs


