China Toy (HS: 9503) Exports, from Jan. to Mar. 2014
China Toy Export Volume and Value, from Jan. to Mar. 2014
| Month | Volume (-) | Value (USD) | Compared with the same period last year | |
|
|
|
| Volume | Value |
| Jan. | 5,056,191,835 | 1,010,678,204 | 69.4% | 19.9% |
| Feb. | 1,210,782,287 | 510,747,128 | -35.5% | -10.8% |
| Mar. | 2,021,029,355 | 762,862,860 | 45.1% | 19.1% |
| Jan.-Mar. Total | 8,288,003,477 | 2,284,288,192 | 32.5% | 11.1% |
China's export value for toys from Jan. to Mar. 2014 amounted to 2.284 billion US dollars, an increase of 11.1% compared with the same period of previous year.
China Toy Major Export Countries/Regions Distribution, from Jan. to Mar. 2014
| No. | Country | Volume (-) | Value (USD) | Compared with the same period last year | |
|
|
|
|
| Volume | Value |
| 1 | USA | 1,331,388,693 | 695,793,501 | -7.7% | 10% |
| 2 | Hong Kong | 223,193,149 | 168,184,719 | -28.4% | 7.1% |
| 3 | United Kingdom | 140,315,193 | 127,945,453 | 0.9% | 12.5% |
| 4 | Philippines | 240,311,157 | 120,273,998 | 18.3% | 48.1% |
| 5 | Japan | 143,268,576 | 110,523,223 | -4.3% | -7.1% |
| 6 | Germany | 106,093,038 | 96,293,591 | -1% | 5.5% |
| 7 | Russian Federation | 110,914,002 | 75,719,362 | 98.5% | 19.3% |
| 8 | Singapore | 117,699,322 | 67,689,120 | 11.9% | -2.5% |
| 9 | Netherlands | 152,116,232 | 53,499,708 | 17.1% | 37% |
| 10 | Republic of Korea | 50,827,940 | 49,894,926 | 16.7% | 30.1% |
| 11 | Canada | 85,028,510 | 48,843,027 | -4.3% | 7.3% |
| 12 | France | 56,700,483 | 44,083,162 | -19.4% | 4.7% |
| 13 | Mexico | 347,510,844 | 42,905,707 | 762.9% | 43.7% |
| 14 | Australia | 45,626,395 | 42,070,589 | -8% | 2.5% |
| 15 | United Arab Emirates | 76,258,714 | 38,785,649 | 15.2% | 29.6% |
| 16 | Belgium | 59,372,743 | 37,212,825 | 37.1% | 14% |
| 17 | Spain | 71,526,849 | 36,154,114 | 21% | 40% |
| 18 | Brazil | 46,187,812 | 34,499,603 | -11.1% | 12.8% |
| 19 | Italy | 79,566,535 | 32,846,572 | 39.8% | 21.3% |
| 20 | Chile | 65,953,300 | 25,578,499 | -45% | 17.3% |

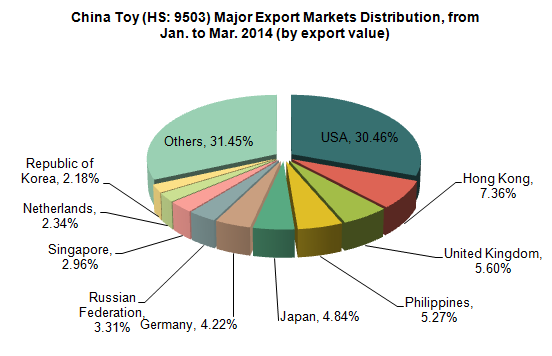
China’s toys main export markets were the United States, Hong Kong, the United Kingdom, the Philippines and Japan and so on from Jan. to Mar., 2014. Among which, the export value to the United States accounted for 30.46% of the total export value of the products.
China Toy Original Places of Exported Goods, from Jan. to Mar. 2014
| No. | Region | Volume (-) | Value (USD) | Compared with the same period last year | |
| Volume | Value | ||||
| 1 | Guangdong | 2,087,921,889 | 1,487,474,144 | -0.5% | 9.7% |
| 2 | Zhejiang | 1,078,949,393 | 280,115,299 | 23.2% | 20.3% |
| 3 | Jiangsu | 1,134,277,293 | 206,780,001 | 79.8% | 12.7% |
| 4 | Shanghai | 76,568,843 | 79,354,166 | 56% | 2.1% |
| 5 | Shandong | 37,232,768 | 62,892,636 | -6.9% | 8.4% |
| 6 | Jiangxi | 56,784,915 | 47,384,752 | 31% | 6.2% |
| 7 | Fujian | 106,575,571 | 44,884,308 | -10.8% | 23.2% |
| 8 | Anhui | 27,607,679 | 41,605,005 | 4.8% | 14.2% |
| 9 | Hebei | 3,562,857,490 | 11,008,286 | 78.2% | 56.8% |
| 10 | Guangxi Zhuang Autonomous Region | 47,444,470 | 6,408,148 | 110.4% | 55.7% |
China’s toys were exported mainly from Guangdong, Zhejiang and Jiangsu, from Jan. to Mar. 2014. Among which, the export value of Guangdong accounted for 65.12% of China's total export value for the product, while the export value of Zhejiang and Jiangsu accounted for 12.26% and 9.05% respectively of China's total export value for this product.
(Source: Customs Information Network)


