China Engineered Wood Flooring Export Volume and Value from Jan. to Sep. of 2013
| Month | Volume(Cubic Meters) | Value(USD) | Compared with the same period of last year | |
| Volume | Value | |||
| Jan | 60,409 | 65,475,080 | 12.6% | 15.3% |
| Feb | 32,680 | 40,654,688 | 20.1% | 66.5% |
| Mar | 44,004 | 46,644,442 | -18.3% | -9.7% |
| Apr | 56,457 | 58,576,076 | 8% | 14.6% |
| May | 61,800 | 67,255,597 | 9.9% | 16.5% |
| Jun | 58,092 | 64,055,248 | 6.3% | 10.4% |
| Jul | 63,938 | 69,403,555 | 12.8% | 16.4% |
| Aug | 60,824 | 63,437,626 | -4.3% | -5.2% |
| Sep | 58,172 | 64,110,482 | 6.2% | 6.6% |
| Total | 496,376 | 539,612,794 | 5% | 10.9% |
From Jan. to Sep. of 2013, China engineered wood flooring Export Volume reached 496.4 thousand cubic meters, which increased 5% compared with the same period of last year. And the export value reached $ 540 million, which increased 10.9% compared with the same period of last year.
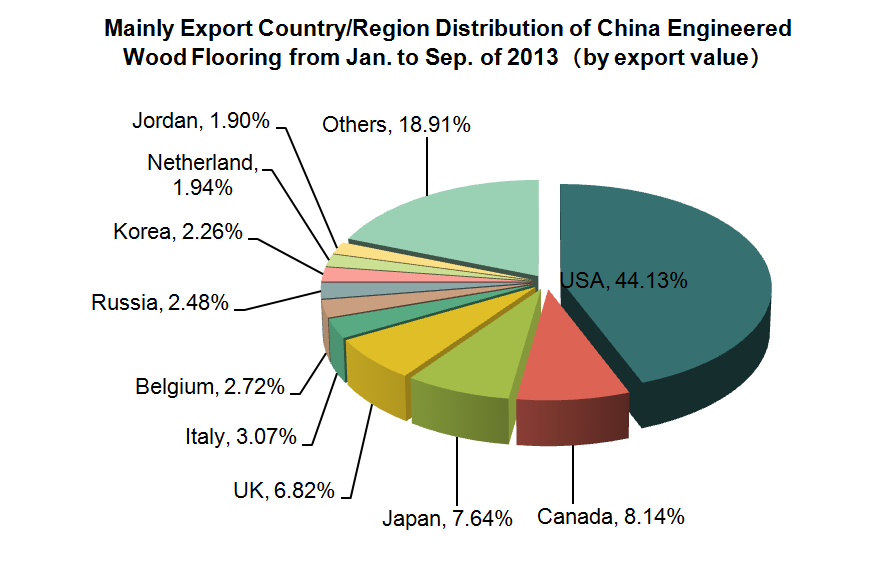
Mainly Export Country/Region Distribution of China Engineered Wood Flooring from Jan. to Sep. of 2013
| No. | Country | Volume(Cubic Meters) | Value(USD) | Compared with the same period of last year | |
| Volume | Value | ||||
| 1 | USA | 170,406 | 238,121,622 | 28.3% | 34.8% |
| 2 | Canada | 29,767 | 43,932,706 | 30.2% | 31.3% |
| 3 | Japan | 22,716 | 41,244,308 | -6.4% | 3.6% |
| 4 | UK | 24,812 | 36,824,259 | -1.9% | 5.3% |
| 5 | Italy | 8,744 | 16,544,584 | -28.3% | -22.7% |
| 6 | Belgium | 8,579 | 14,675,653 | -28% | -24.4% |
| 7 | Russia | 7,817 | 13,357,798 | -6.6% | -2.1% |
| 8 | Korea | 9,466 | 12,185,457 | -17.7% | -7.6% |
| 9 | Netherland | 6,502 | 10,462,211 | -26.1% | -26% |
| 10 | Jordan | 24,296 | 10,243,010 | 4.5% | 13.2% |

From Jan. to Sep. of 2013, mainly Export Country/Region Distribution of China engineered wood flooring includes USA, CANADA, JAPAN and UK, which export value took 44.13%, 8.14%, 7.64% and 6.82% of whole value.
Data Source:China Custom


