2011-2013 China Golf Club Export Volume Trend

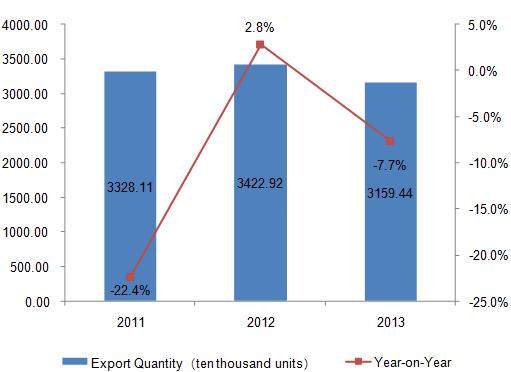
China export volume of golf club showed an inverted V-shaped trend from 2011 to 2013, and the export volume for the three years amounted to 33.2811 million (a year-on-year decrease of 22.4%), 34.2292 million (a year-on-year increase of 2.8%) and 31.5944 million (a year-on-year decrease of 7.7%) respectively.
2011-2013 China Golf Club Export Value Trend

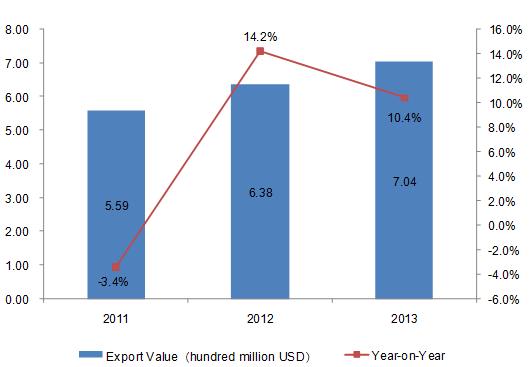
China export value of golf club increased year by year from 2011 to 2013, and the export value for the three years amounted to 559 million US dollars (a year-on-year decrease of 3.4%), 638 million US dollars (a year-on-year increase of 14.2%) and 704 million US dollars (a year-on-year increase of 10.4%) respectively.
2011-2013 China Golf Club Export Average Unit Price Trend

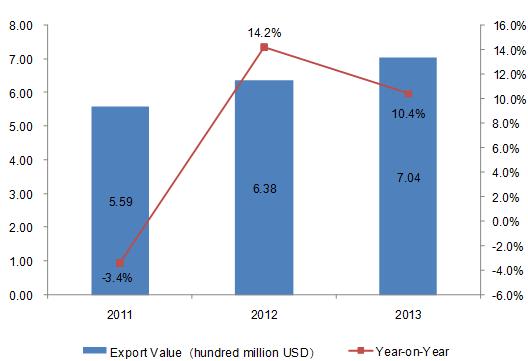
As can be seen from the above chart, China average export unit price of golf club rose significantly from 2011 to 2013. The average export unit price for 2013 increased by 19.55% compared with the same period of 2012.
2011-2013 China Golf Club Export Market Trends Analysis
2011-2013 China Golf Club Export Value Growth to Major Export Countries/Regions
| No. | Export Countries/Regions | Export Value (USD) | Export Value Growth Compared 2013 with 2011 | ||
| 2011 | 2012 | 2013 | |||
| 1 | Hong Kong | 164,582,261 | 201,754,572 | 310,627,559 | 88.74% |
| 2 | USA | 203,353,091 | 228,030,439 | 203,554,353 | 0.10% |
| 3 | Japan | 55,317,464 | 65,978,765 | 74,912,947 | 35.42% |
| 4 | United Kingdom | 47,712,867 | 55,859,201 | 29,605,388 | -37.95% |
| 5 | Canada | 33,329,909 | 28,423,664 | 26,360,397 | -20.91% |
| 6 | Republic of Korea | 14,064,230 | 14,191,156 | 17,464,035 | 24.17% |
| 7 | Australia | 8,171,633 | 9,335,415 | 7,411,537 | -9.30% |
| 8 | Malaysia | 1,628,183 | 2,182,665 | 4,347,077 | 166.99% |
| 9 | Netherlands | 6,591,145 | 2,206,775 | 4,155,264 | -36.96% |
| 10 | Singapore | 3,941,314 | 4,951,583 | 3,744,205 | -5.00% |
| 11 | Thailand | 1,814,845 | 2,063,683 | 3,530,266 | 94.52% |
| 12 | South Africa | 3,220,541 | 4,278,272 | 3,233,754 | 0.41% |
| 13 | Taiwan | 2,096,482 | 2,467,998 | 2,773,553 | 32.30% |
| 14 | Indonesia | 14,199 | 162,657 | 2,712,184 | 19001.23% |
| 15 | France | 2,379,401 | 2,397,651 | 1,479,317 | -37.83% |
| 16 | Belgium | 550,243 | 2,363,405 | 1,160,960 | 110.99% |
| 17 | Sweden | 2,586,954 | 1,187,417 | 1,077,949 | -58.33% |
| 18 | India | 517,538 | 722,647 | 777,516 | 50.23% |
| 19 | Germany | 3,733,332 | 3,709,396 | 697,779 | -81.31% |
| 20 | Argentina | 968,295 | 262,871 | 565,271 | -41.62% |
As can be seen from the above chart, Hong Kong, the United States and Japan are our country's three largest export markets of golf club. In 2013, Hong Kong surpassed the United States, becoming the largest golf clubs export market of China.
Among the twenty export markets above, the export value of China to Indonesia increased the most, an increase of 19001.23% compared 2013 with 2011, followed by Malaysia, an increase of 166.99%.
2011-2013 China Golf Club Major Export Countries/Regions Market Share Trend
| No. | Export Countries/Regions | Export Value Percentage | ||
| 2011 | 2012 | 2013 | ||
| 1 | Hong Kong↑ | 29.44% | 31.62% | 44.11% |
| 2 | USA↓ | 36.38% | 35.73% | 28.91% |
| 3 | Japan↑ | 9.90% | 10.34% | 10.64% |
| 4 | United Kingdom | 8.53% | 8.75% | 4.20% |
| 5 | Canada↓ | 5.96% | 4.45% | 3.74% |
| 6 | Republic of Korea | 2.52% | 2.22% | 2.48% |
| 7 | Australia | 1.46% | 1.46% | 1.05% |
| 8 | Malaysia↑ | 0.29% | 0.34% | 0.62% |
| 9 | Netherlands | 1.18% | 0.35% | 0.59% |
| 10 | Singapore | 0.71% | 0.78% | 0.53% |
| 11 | Thailand | 0.32% | 0.32% | 0.50% |
| 12 | South Africa | 0.58% | 0.67% | 0.46% |
| 13 | Taiwan | 0.38% | 0.39% | 0.39% |
| 14 | Indonesia↑ | 0.003% | 0.03% | 0.39% |
| 15 | France↓ | 0.43% | 0.38% | 0.21% |
| 16 | Belgium | 0.10% | 0.37% | 0.16% |
| 17 | Sweden↓ | 0.46% | 0.19% | 0.15% |
| 18 | India | 0.09% | 0.11% | 0.11% |
| 19 | Germany↓ | 0.67% | 0.58% | 0.10% |
| 20 | Argentina | 0.17% | 0.04% | 0.08% |
Note: “↑”represents that the indicators listed continued to increase from 2011 to 2013, “↓”represents that the indicators listed continued to decrease from 2011 to 2013.
The data of 2013 shows that Hong Kong, the USA and Japan, the three largest export markets of golf clubs from China, accounted for 44.11%, 28.91% and 10.64% of the total export value respectively.
Judging from the export market share trends, the market share for Hong Kong, Japan, Malaysia and Indonesia continued to rise, while that for the USA, Canada, France, Sweden and Germany continued to decline.


