2009-2011 Global Extruding Machines Import Value
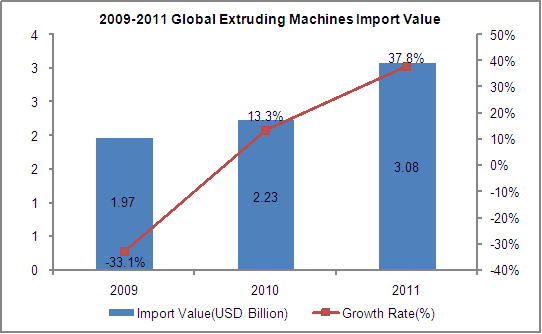
In the year between 2009 and 2011, Global extruding machines import value increased year by year. The total import value of 2011 was 3.08 billion dollars, up 37.8% year on year, and its growth rate increased 24.5% compared to 2010.
Major Global Extruding Machines Importers from 2009 to 2011
| No. | Countries/Regions | Import Value(US Dollar Million) | Amount in 2011 Compared with 2009 | ||
|
|
| 2009 | 2010 | 2011 |
|
| 1 | China | 313.3 | 416.1 | 582.3 | 85.87% |
| 2 | Russian Federation | 145.1 | 134.9 | 270.7 | 86.58% |
| 3 | Brazil | 74.0 | 76.7 | 140.6 | 90.10% |
| 4 | South Korea | 49.5 | 76.7 | 138.8 | 180.39% |
| 5 | Turkey | 65.9 | 91.3 | 138.7 | 110.61% |
| 6 | India | 48.4 | 66.0 | 138.2 | 185.84% |
| 7 | Thailand | 84.9 | 82.2 | 128.7 | 51.71% |
| 8 | USA | 81.4 | 79.7 | 121.8 | 0.4954 |
| 9 | Indonesia | 90.3 | 64.9 | 91.6 | 1.44% |
| 10 | Taiwan, China | 29.9 | 60.5 | 86.5 | 188.74% |
| 11 | Germany | 35.4 | 37.2 | 76.3 | 115.37% |
| 12 | Mexico | 61.7 | 94.9 | 69.8 | 13.18% |
| 13 | Poland | 16.4 | 22.7 | 47.7 | 190.10% |
| 14 | Malaysia | 24.8 | 32.2 | 46.6 | 87.92% |
| 15 | South Africa | 20.4 | 23.7 | 42.8 | 109.33% |
| 16 | Vietnam | 32.4 | 36.7 | 40.3 | 24.44% |
| 17 | Japan | 26.4 | 30.6 | 38.9 | 47.27% |
| 18 | France | 33.4 | 28.7 | 37.5 | 12.24% |
| 19 | Italy | 39.4 | 31.1 | 34.7 | -11.85% |
| 20 | Chile | 9.6 | 18.7 | 32.5 | 238.92% |
China is the largest importer of extruding machines, and the import value reached 582 million dollars in 2011, accounting for 18.93% of the total global import value. Followed by Russian Federation and Brazil, they occupied 8.80% and 4.57 respectively of the total global import value.
Among the top 20 countries/regions mentioned above, in comparison with 2009, the largest increased countries/regions in 2011 were Chile (up 238.92%). What’s more, the countries/ regions which growth rate was double were as follows: Poland (a rise of 180.39%), Taiwan (an increased by 188.74%), India (up 185.84%), South Korea (a growth of 180.39%), Germany (up 115.37%), Turkey (a rise of 110.61%) and South Africa (an increased by 109.33%). The top two countries/regions with largest increase of import value were as follows: China (a rise of 269 million dollars) and Russian Federation (a increased by 126 million dollars).
The Market Share of Major Global Extruding Machines Importers from 2009 to 2011
| No. | Countries/Regions | Proportion of Import Value (%) | ||
|
|
| 2009 | 2010 | 2011 |
| 1 | China ↑ | 15.89% | 18.63% | 18.93% |
| 2 | Russian Federation | 7.36% | 6.04% | 8.80% |
| 3 | Brazil | 3.75% | 3.43% | 4.57% |
| 4 | South Korea↑ | 2.51% | 3.43% | 4.51% |
| 5 | Turkey↑ | 3.34% | 4.09% | 4.51% |
| 6 | India↑ | 2.45% | 2.96% | 4.49% |
| 7 | Thailand | 4.30% | 3.68% | 4.18% |
| 8 | USA | 0.0413 | 3.57% | 3.96% |
| 9 | Indonesia | 4.58% | 2.91% | 2.98% |
| 10 | Taiwan, China↑ | 1.52% | 2.71% | 2.81% |
| 11 | Germany | 1.80% | 1.67% | 2.48% |
| 12 | Mexico | 3.13% | 4.25% | 2.27% |
| 13 | Poland↑ | 0.83% | 1.02% | 1.55% |
| 14 | Malaysia↑ | 1.26% | 1.44% | 1.51% |
| 15 | South Africa↑ | 1.04% | 1.06% | 1.39% |
| 16 | Vietnam | 1.64% | 1.64% | 1.31% |
| 17 | Japan | 1.34% | 1.37% | 1.27% |
| 18 | France↓ | 1.70% | 1.28% | 1.22% |
| 19 | Italy↓ | 2.00% | 1.39% | 1.13% |
| 20 | Chile↑ | 0.49% | 0.84% | 1.06% |
Note: "↑" indicates that the proportion covered by import value in the total global import value grew continuously from 2009 to 2011. "↓" shows that the proportion covered by import value in the total global import value declined continuously from 2009 to 2011.
According to the table, the countries/regions which proportion covered by import value in the total global import value grew continuously from 2009 to 2011 were as follows: China, South Korea, Turkey, India, Taiwan, Poland, Malaysia, South Africa and Chile. Among all the countries/regions mentioned above, China, India and South Korea grew the most sharply, which were up 3.04%, 2.04% and 2.00% respectively in 2011 compared to 2009.
France and Italy were the countries which proportion covered by import value in the total global import value declined continuously, and Italy decreased 0.87% with a sharp drop.


