Export Quantity & Value for Chinese Microwave Oven from Jan. to Dec. 2013
| Month | Quantity (Piece) | Value (USD) | Year on Year | |
| Quantity | Value | |||
| Jan. | 4,466,091 | 208,747,581 | 22.5% | 18.3% |
| Feb. | 3,368,732 | 160,511,953 | 0.1% | -1.9% |
| March | 4,668,808 | 223,800,497 | -2.1% | -2.1% |
| April | 4,511,943 | 211,408,980 | 1.8% | -1.2% |
| May | 4,766,185 | 231,283,468 | 2.6% | 1.6% |
| June | 4,391,160 | 209,538,114 | -10.5% | -10.4% |
| July | 4,678,336 | 228,380,510 | -0.9% | 0.1% |
| August | 4,857,553 | 236,996,111 | 1.1% | 2.3% |
| Sep. | 4,356,731 | 215,161,566 | -17.7% | -15.6% |
| Oct. | 5,112,782 | 245,203,434 | 10% | 10% |
| Nov. | 4,784,182 | 228,646,235 | 21.4% | 16% |
| Dec. | 4,370,591 | 208,809,473 | -6.3% | -2.2% |
| Total from Jan. to Dec. | 54,333,094 | 2,608,487,922 | 0.9% | 0.6% |
The total export quantity for Chinese microwave oven from Jan. to Dec. 2013 achieved 54.3331 million pieces, and increased 0.9% year on year. The total export value reached 2608 million USD, and increased 0.6% year on year.
Major Countries/Regions for Chinese Microwave Oven Export from Jan. to Dec. 2013
| No. | Countries/Regions | Quantity (Piece) | Value (USD) | Year on Year | |
| Quantity | Value | ||||
| 1 | USA | 14,932,635 | 847,747,915 | 0.9% | 4.3% |
| 2 | Japan | 2,378,263 | 195,261,144 | -1.8% | -6.4% |
| 3 | Brazil | 4,541,198 | 158,918,860 | -8.8% | -11.8% |
| 4 | United Kingdom | 3,845,973 | 158,276,182 | 5.9% | 3.4% |
| 5 | Germany | 2,111,940 | 100,442,085 | 6.2% | -1.1% |
| 6 | Canada | 1,819,092 | 100,167,021 | 24.9% | 23.7% |
| 7 | Russian Federation | 2,469,717 | 95,431,482 | -19.1% | -17.4% |
| 8 | France | 2,035,975 | 88,877,301 | 9% | 2.2% |
| 9 | Mexico | 1,471,993 | 65,757,427 | -0.3% | -3.1% |
| 10 | Australia | 993,153 | 54,275,282 | -11.2% | -10.1% |
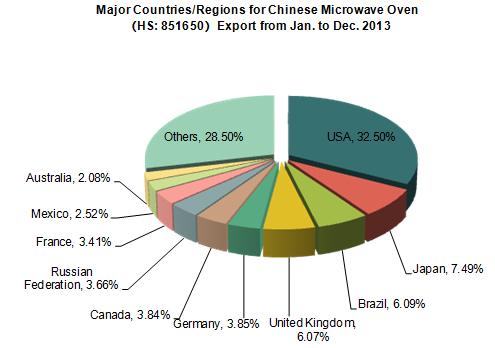
USA ranked first for Chinese microwave oven export. The total export value to USA for Chinese microwave oven from Jan. to Dec. 2013 was about 848 million USD, increased 4.3% year on year, and occupied 32.5% of all. Followed by Japan, and occupied 7.49%.
Major Cities/Provinces for Chinese Microwave Oven Export from Jan. to Dec. 2013
| No. | Cities/Provinces | Quantity (Piece) | Value (USD) | Year on Year | |
| Quantity | Value | ||||
| 1 | Guangdong | 42,143,308 | 1,845,628,682 | 3.3% | 5.7% |
| 2 | Tianjin | 8,620,462 | 442,450,062 | -6.6% | -12.2% |
| 3 | Shanghai | 3,406,054 | 314,405,336 | -9.4% | -7.9% |
| 4 | Anhui | 150,382 | 4,823,958 | 932.4% | 710.4% |
| 5 | Zhejiang | 11,169 | 1,068,476 | -3.3% | 3.8% |
| 6 | Inner Mongolia | 616 | 33,875 | 21.3% | 22.7% |
| 7 | Jiangsu | 506 | 32,340 | -20.4% | -4.8% |
| 8 | Jilin | 384 | 19,486 | 4166.7% | 1555.6% |
| 9 | Beijing | 79 | 9,305 | 19.7% | 49.1% |
| 10 | Shandong | 16 | 3,402 | 0 | 0 |
The major city/province for Chinese microwave oven export was Guangdong, which occupied 77.56% and 70.75% of the total export quantity & value from Jan. to Dec. 2013 respectively. Both the export quantity & value of Jilin increased significantly among the top 10 cities/provinces for Chinese microwave oven, which were 4166.7% and 1555.6% year on year respectively.


