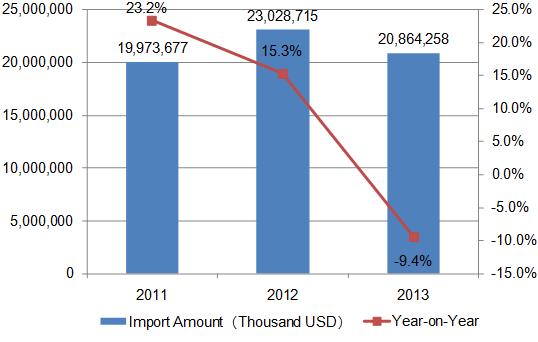
2011-2013 Japan Yearly Import Sales Trend for Medicine Industry

Japan medicine import turnover from 2011-2013 is 19.97 billion USD, 23.03 billion USD, 20.86 billion USD, the import turnover increased 4.5% compared to 2011.
2011-2013 Medicine Trend Analysis of Top Countries Japan Imports From
| No. | County/Region | Import Turnover (USD) | Growth in 2013 Compared with 2011
| ||
| 2011 | 2012 | 2013 | |||
|
| Total | 19,973,677 | 23,028,715 | 20,864,258 | 4.5% |
| 1 | United States | 4,356,199 | 5,173,916 | 4,354,220 | 0.0% |
| 2 | Germany | 3,072,394 | 3,864,552 | 3,648,113 | 18.7% |
| 3 | Switzerland | 2,486,567 | 2,865,439 | 2,179,103 | -12.4% |
| 4 | France | 1,635,219 | 2,022,564 | 2,150,145 | 31.5% |
| 5 | Italy | 1,694,057 | 2,122,795 | 1,971,036 | 16.4% |
| 6 | Singapore | 1,004,571 | 1,287,449 | 1,161,916 | 15.7% |
| 7 | United Kingdom | 1,342,320 | 1,363,380 | 1,060,126 | -21.0% |
| 8 | Belgium | 697,194 | 686,443 | 631,021 | -9.5% |
| 9 | Spain | 1,116,831 | 658,856 | 598,397 | -46.4% |
| 10 | Denmark | 471,802 | 535,859 | 464,931 | -1.5% |
The United States is the largest country Japan import medicine from 2011 to 2013, Germany and Switzerland ranks second and third, respectively.
2011-2013 Medicine Market Share Analysis of Top Countries Japan Imports from
| No. | County/Region | Import Value Percentage | ||
| 2011 | 2012 | 2013 | ||
| 1 | United States | 21.8% | 22.5% | 20.9% |
| 2 | Germany↑ | 15.4% | 16.8% | 17.5% |
| 3 | Switzerland | 12.4% | 12.4% | 10.4% |
| 4 | France↑ | 8.2% | 8.8% | 10.3% |
| 5 | Italy↑ | 8.5% | 9.2% | 9.4% |
| 6 | Singapore | 5.0% | 5.6% | 5.6% |
| 7 | United Kingdom↓ | 6.7% | 5.9% | 5.1% |
| 8 | Belgium | 3.5% | 3.0% | 3.0% |
| 9 | Spain | 5.6% | 2.9% | 2.9% |
| 10 | Denmark↓ | 2.4% | 2.3% | 2.2% |
Note: “↑”represents that the data listed continued to increase from 2011 to 2013, “↓”represents that the data listed continued to decrease from 2011 to 2013.
Among the top 10 import markets, the market share of Germany, France and Italy continued to increase, wherever the market share of United Kingdom, Denmark continued to decrease.
Top Countries That Japan Imports Medicine from Jan. to Dec. 2014
| County/Region | Import Turnover (Thousand USD ) | Year-on-Year | Market Share |
| Total | 19,981,639 | -4.2% | 100% |
| United States | 4,720,429 | 8.4% | 23.6% |
| Germany | 3,580,135 | -1.9% | 17.9% |
| Switzerland | 2,044,730 | -6.2% | 10.2% |
| France | 1,874,500 | -4.9% | 9.4% |
| Italy | 1,257,933 | -41.5% | 6.3% |
| Singapore | 1,082,120 | -6.9% | 5.4% |
| United Kingdom | 814,723 | -23.1% | 4.1% |
| Belgium | 735,151 | 22.9% | 3.7% |
| Spain | 549,570 | -12.9% | 2.8% |
| Denmark | 514,962 | 10.8% | 2.6% |
Japan import turnover of 2014 is 19.98 billion USD, decreased 4.2% Year-on-Year, the United States is the original places of exported goods, the import turnover from the United States of 2014 accounted for 23.6%, is 4.72 billion USD. Among all the countries Japan import from, China is ranked 14th.


