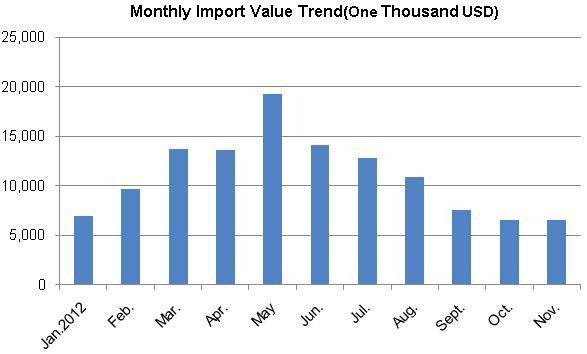
Main import sources of electric vehicles for Germany are: China, Japan, Netherlands, Hungary, Austria, Vietnam, Taiwan, France, Belgium and the Czech Republic from Jan. to Nov. in 2012. Among them, China is the country of their primary imports sources. The cumulative amount of imports from China was 48.766 million USD from Jan. To Nov., accounting for 21.91% of total imports; followed by Japan and Netherlands, accounting for 20.44% and 14.97 % of the market share.
It can be seen from the amount of monthly imports trend that demand in the second half year was significantly lower than the first half from Jan. to Nov. in 2012.Note:
HS:871190
Electric motorcycles, electric power bikes, nes motorcycles and bicycles equipped with auxiliary power; sidecar, hereinafter referred to as "electric vehicle"

Major Demand Countries / Regions for Electric Vehicle (HS: 871190) in 2012
| NO. | Import Countries/Regions | Import Value(Thousand USD) | Over the same period of last year |
| 1 | Germany | 200,074 | 16.20% |
| 2 | Philippines | 158,618 | -25.55% |
| 3 | Netherlands | 108,589 | 39.53% |
| 4 | Switzerland | 75,293 | 29.78% |
| 5 | USA | 40,181 | 32.94% |
| 6 | Belgium | 36,074 | -16.69% |
| 7 | France | 35,661 | 36.57% |
| 8 | Italy | 26,688 | 34.99% |
| 9 | Austria | 24,175 | -8.91% |
| 10 | Japan | 22,390 | 2.47% |
| 11 | Canada | 17,419 | -6.33% |
| 12 | United Kingdom | 11,763 | -26.37% |
| 13 | Spain | 11,254 | 2.68% |
| 14 | Sweden | 8,352 | -7.58% |
| 15 | Turkey | 7,497 | 35.64% |
| 16 | Denmark | 7,402 | -45.83% |
| 17 | Brazil | 6,786 | 28.40% |
| 18 | Czech Republic | 5,717 | 9.44% |
| 19 | Australia | 5,626 | -21.06% |
| 20 | Thailand | 5,057 | 66.13% |
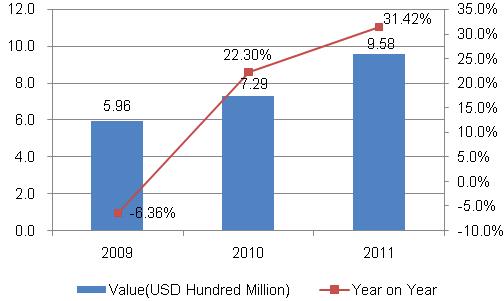
Global demand for electric vehicles continued to rise from 2009 to 2011.the global electric vehicle imports amounted to $ 960 million in 2011, with an increase of 31.42% year on year.
The main demand for electric vehicles countries are Germany, the Philippines, Netherlands, Switzerland, USA, Belgium, France, Italy, Austria, Japan, Canada, United Kingdom, Spain, Sweden, Turkey, Denmark, Brazil, Czech Republic, Australia and Thailand in 2012. Among them, the countries whose amount of imports in 2011 year on year growth of more than twenty percent are Netherlands, Switzerland, USA, France, Italy, Turkey, Brazil and Thailand.
Monthly Trend of Netherlands Import Value of Electric Vehicle from Jan. to Nov.2012

Electric Vehicle Major Importing Countries/Regions of Netherlands from Jan. to Nov.2012
| NO. | Import Countries/Regions | Import Value(Thousand USD) | Account |
| 1 | China | 58,866 | 48.34% |
| 2 | Germany | 32,509 | 26.70% |
| 3 | Japan | 15,016 | 12.33% |
| 4 | Belgium | 5,518 | 4.53% |
| 5 | USA | 2,527 | 2.08% |
| 6 | Czech Republic | 2,348 | 1.93% |
| 7 | Taiwan | 1,661 | 1.36% |
| 8 | France | 1,545 | 1.27% |
| 9 | Denmark | 1,068 | 0.88% |
| 10 | Spain | 245 | 0.20% |
Electric Vehicle Major Importing Countries/Regions of Germany from Jan. to Nov.2012
| NO. | Import Countries/Regions | Import Value(Thousand USD) | Account |
| 1 | China | 48,766 | 21.91% |
| 2 | Japan | 45,498 | 20.44% |
| 3 | Netherlands | 33,308 | 14.97% |
| 4 | Hungary | 28,469 | 12.79% |
| 5 | Austria | 26,124 | 11.74% |
| 6 | Vietnam | 15,527 | 6.98% |
| 7 | Taiwan | 7,942 | 3.57% |
| 8 | France | 6,066 | 2.73% |
| 9 | Belgium | 4,973 | 2.23% |
| 10 | Czech Republic | 3,829 | 1.72% |
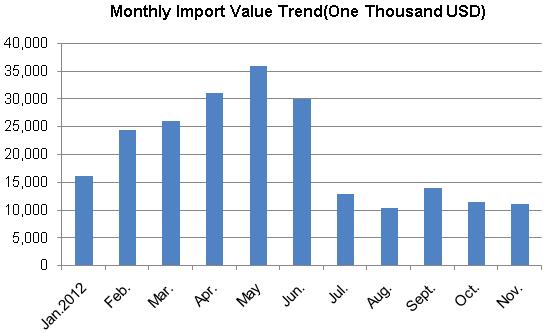
Main import sources of electric vehicles for Netherlands are: China, Germany, Japan, Belgium, USA, Czech Republic, Taiwan, France, Denmark and Spain from Jan. to Nov. in 2012. Among them, China is the country of their primary imports sources. The cumulative amount of imports from China was 58.866 million USD from Jan. To Nov., accounting for 48.34% of total imports, nearly half; followed by Germany and Japan, accounting for 26.7% and 12.33 % of the market share.
It can be seen from the amount of monthly imports trend that imports in May was the highest from Jan. to Nov. in 2012.
Monthly Trend of USA Import Value of Electric Vehicle from Jan. to Nov.2012

Electric Vehicle Major Importing Countries/Regions of USA from Jan. to Nov.2012
| NO. | Import Countries/Regions | Import Value(Thousand USD) | Account |
| 1 | China | 33,350 | 83.00% |
| 2 | Taiwan | 3,930 | 9.78% |
| 3 | Mexico | 643 | 1.60% |
| 4 | Hungary | 438 | 1.09% |
| 5 | Germany | 419 | 1.04% |
| 6 | Australia | 328 | 0.82% |
| 7 | Spain | 266 | 0.66% |
| 8 | India | 242 | 0.60% |
| 9 | Poland | 192 | 0.48% |
| 10 | Netherlands | 99 | 0.25% |
Main import sources of electric vehicles for USA are: China, Taiwan, Mexico, Hungary, Germany, Australia, Spain, India, Poland and Netherlands from Jan. to Dec. in 2012. Among them, China is the country of their primary imports sources. The cumulative amount of imports from China was 33.35 million USD from Jan. To Dec., accounting for 83% of total imports, with a large market share and obvious competitive advantage.
It can be seen from the amount of monthly imports trend that demand in the second half year was higher than in the first half from Jan. to Dec. in 2012.
Electric Vehicle Major Importing Countries/Regions of Italy from Jan. to Nov.2012
| NO. | Import Countries/Regions | Import Value(Thousand USD) | Account |
| 1 | China | 24,233 | 75.97% |
| 2 | United Kingdom | 1,564 | 4.90% |
| 3 | Belgium | 1,422 | 4.46% |
| 4 | Germany | 1,415 | 4.44% |
| 5 | France | 1,031 | 3.23% |
| 6 | USA | 702 | 2.20% |
| 7 | Netherlands | 484 | 1.52% |
| 8 | Switzerland | 313 | 0.98% |
| 9 | Poland | 304 | 0.95% |
| 10 | Taiwan | 147 | 0.46% |
Main import sources of electric vehicles for Italy are: China, United Kingdom, Belgium, Germany, France, USA, Netherlands, Switzerland, Poland and Taiwan from Jan. to Nov. in 2012. Among them, China is the country of their primary imports sources. The cumulative amount of imports from China was 24.233 million USD from Jan. to Dec., accounting for 75.97% of total imports, with a comparatively large market share.
It can be seen from the amount of monthly imports trend that May, June and July were the comparatively larger months of imports from Jan. to Nov. in 2012.
Source: UN COMTRADE


