China Industrial Equipment & Components Export Analysis
The Export Analysis of China Screws, Bolts, Nuts and Rivets between Jan. - Jun. 2013
The Export Volume and Value Analysis of China Screws, Bolts, Nuts & Rivets between Jan. - Jun. 2013
| Months | Volume(Kg) | Value(One hundred million U.S. dollars) | Compared with the same period of last year | |
|
|
|
| Volume | Value |
| Jan. | 220,321,696 | 3.98 | 7.4% | 4.9% |
| Feb. | 147,942,532 | 2.72 | 27.0% | 24.9% |
| Mar. | 180,693,837 | 3.28 | -12.8% | -14.1% |
| Apr. | 217,840,388 | 3.88 | -0.4% | -1.4% |
| May | 237,088,145 | 4.21 | -1.9% | -4.1% |
| Jun. | 226,755,819 | 4.00 | 4.1% | -0.2% |
| Total | 1,230,642,417 | 22.07 | 2.0% | -0.2% |
The export value of China Screws, bolts, nuts & rivets, reached $ 2.21 billion between Jan. - Jun.2013, which dropped 0.2% as before.
Mainly Export Countries/Regions of China Screws, Bolts, Nuts & Rivets between Jan and Jun of 2013
| No. | Country | Volume(Kg) | Value(USD) | Compared with the same period of last year | |
|
|
|
|
| Volume | Value |
| 1 | USA | 230,265,795 | 420,904,839 | -6.3% | -11.7% |
| 2 | Russia | 129,773,604 | 171,272,484 | 42.7% | 31.0% |
| 3 | Jan | 75,984,149 | 157,283,856 | 23.3% | 8.3% |
| 4 | HK | 15,983,542 | 80,775,922 | -16.1% | 14.9% |
| 5 | Korea | 42,747,185 | 71,773,749 | 18.8% | 11.3% |
| 6 | Australia | 32,794,973 | 63,138,826 | -12.7% | -18.2% |
| 7 | Germany | 29,459,589 | 61,249,481 | -10.9% | -10.7% |
| 8 | Vietnam | 15,390,404 | 56,080,884 | 3.0% | 22.7% |
| 9 | Brazil | 31,931,982 | 55,275,963 | 14.9% | 21.3% |
| 10 | Saudi Arabia | 40,215,516 | 53,248,757 | 41.3% | 33.8% |
| 11 | India | 28,561,385 | 53,180,160 | -16.5% | -7.9% |
| 12 | UAE | 33,458,406 | 51,893,133 | -9.2% | -8.7% |
| 13 | Canada | 30,782,621 | 49,676,584 | -7.2% | -8.2% |
| 14 | Singapore | 19,157,116 | 48,121,997 | -4.0% | -1.8% |
| 15 | Malaysia | 24,181,066 | 42,803,452 | 3.4% | 4.5% |
| 16 | UK | 17,994,003 | 38,710,010 | -6.1% | -8.5% |
| 17 | Thailand | 20,189,343 | 37,300,801 | -31.0% | -23.7% |
| 18 | Mexico | 19,115,277 | 35,255,261 | 5.8% | 0.0% |
| 19 | Italy | 17,937,675 | 34,076,583 | 1.1% | -8.2% |
| 20 | Turkey | 18,937,729 | 31,306,131 | -16.4% | -11.9% |
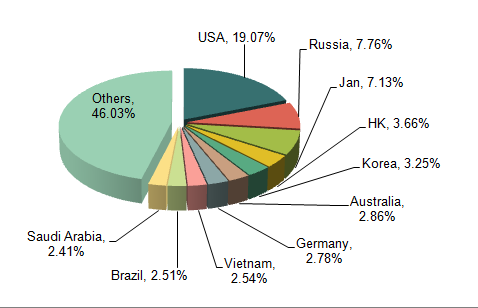
At the first half year of 2013, the mainly import countries of China Screws, bolts, nuts & rivets include USA, Russia, Japan, HK, Korea, Australia, Germany, Vietnam, Brazil and Saudi Arabia etc. The export value to USA hold 19.1% of whole value, and Russia is next, which took 7.8%.
The Goods Delivered Places of China Screws, Bolts, Nuts & Rivets between Jan - Jun of 2013
| No. | Regions | Volume(Kg) | Value(USD) | Compared with last year | |
|
|
|
|
| Volume | Value |
| 1 | Zhejiang | 723,947,875 | 1,070,096,627 | 1.4% | -4.1% |
| 2 | Shanghai | 150,153,081 | 287,670,104 | -2.6% | -9.0% |
| 3 | Jiangsu | 106,717,120 | 278,721,160 | 7.6% | 4.9% |
| 4 | Guangdong | 61,853,869 | 222,028,983 | -12.7% | 15.2% |
| 5 | Hebei | 61,475,741 | 85,341,865 | 38.2% | 34.3% |
| 6 | Shandong | 42,329,407 | 82,862,668 | 2.6% | -3.1% |
| 7 | Tianjin | 35,895,303 | 49,808,282 | 10.7% | 1.6% |
| 8 | Fujian | 15,615,052 | 33,494,187 | -29.7% | -15.5% |
| 9 | Liaoning | 4,082,769 | 17,009,804 | 5.7% | -7.1% |
| 10 | Beijing | 3,561,993 | 11,964,239 | 43.2% | 18.0% |
The mainly goods delivered places include Zhejiang, Shanghai, Jiangsu and Guangdong.
The Export Analysis of China Pumps between Jan. – Jun. 2013
The Export Volume and Value of China Pumps between Jan. – Jun. 2013.
| Months | Volume(-) | Value(One hundred million U.S. dollars) | Compared with the same period of last year | |
|
|
|
| Volume | Value |
| Jan. | 102,760,036 | 9.95 | 13.8% | 18.8% |
| Feb. | 74,002,582 | 8.00 | 4.3% | 17.2% |
| Mar. | 97,616,932 | 10.79 | -10.0% | 5.8% |
| Apr. | 109,582,356 | 11.66 | 1.0% | 11.8% |
| May | 114,445,283 | 12.07 | 1.0% | 8.8% |
| Jun. | 101,373,937 | 10.26 | 1.8% | 4.6% |
| Total. | 599,781,126 | 62.72 | 1.5% | 10.6% |
The export value of China pumps reached $ 6.27 billion between Jan. - Jun.2013, which increased 10.6% as before.
Mainly Export Countries/Regions of China Pumps between Jan. – Jun. 2013
| No. | Country | Volume(-) | Value(USD) | Compared with the same period of last year | |
|
|
|
|
| Volume | Value |
| 1 | USA | 96,436,129 | 1,238,392,713 | 3.6% | 7.9% |
| 2 | Japan | 44,822,317 | 558,408,998 | -7.7% | -7.0% |
| 3 | HK | 121,904,989 | 432,191,558 | -3.4% | 2.7% |
| 4 | India | 23,993,037 | 334,030,071 | 6.2% | 8.2% |
| 5 | Korea | 24,123,519 | 293,474,722 | 26.5% | 26.3% |
| 6 | Thailand | 17,953,007 | 276,140,966 | 4.4% | 9.2% |
| 7 | Turkey | 10,244,608 | 202,608,836 | 24.1% | 33.7% |
| 8 | Germany | 16,244,441 | 147,281,003 | 2.6% | 10.2% |
| 9 | Indonesia | 16,522,149 | 142,171,857 | -30.6% | 31.8% |
| 10 | Malaysia | 11,655,392 | 136,633,065 | 0.4% | 13.6% |
| 11 | Brazil | 10,623,361 | 128,414,179 | 2.1% | 19.6% |
| 12 | Italy | 10,428,104 | 127,935,470 | 10.1% | 18.9% |
| 13 | Russia | 11,236,810 | 125,043,141 | -8.6% | -12.0% |
| 14 | France | 10,887,719 | 119,920,527 | 16.7% | 15.0% |
| 15 | Taiwan | 18,443,238 | 114,621,854 | 8.9% | 0.8% |
| 16 | UAE | 9,325,559 | 109,047,868 | 13.6% | 14.7% |
| 17 | UK | 7,766,032 | 98,802,182 | 7.6% | 13.1% |
| 18 | Mexico | 8,439,465 | 88,907,406 | 0.6% | -2.8% |
| 19 | Iran | 5,034,504 | 82,453,336 | 47.9% | 53.8% |
| 20 | Canada | 5,618,276 | 79,478,479 | -7.3% | 2.8% |
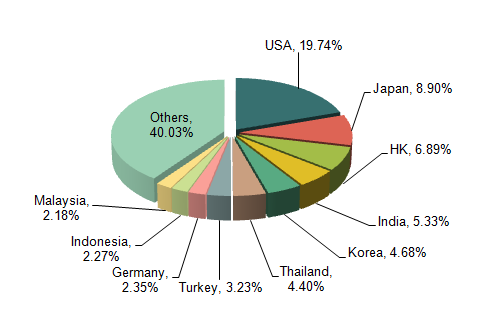
At the first half year of 2013, USA is the biggest country of China pumps export, the export value to USA hold 19.7% of whole value, and Japan is next, which took 8.9%.
The Goods Delivered Places of China Pump between Jan. - Jun. 2013
| No. | Regions | Volume(-) | Value(USD) | Compared with the same period of last year | |
|
|
|
|
| Volume | Value |
| 1 | Guangdong | 298,475,932 | 2,719,770,292 | -1.8% | 8.5% |
| 2 | Jiangsu | 55,867,829 | 918,329,234 | 6.1% | 10.6% |
| 3 | Zhejiang | 104,004,779 | 851,936,712 | 12.3% | 20.0% |
| 4 | Shanghai | 52,321,994 | 647,378,461 | 2.4% | 4.8% |
| 5 | Shandong | 9,779,835 | 201,913,394 | 7.3% | 16.3% |
| 6 | Tianjin | 7,971,288 | 183,687,618 | 15.0% | -0.1% |
| 7 | Liaoning | 12,655,818 | 176,579,811 | -12.9% | 6.0% |
| 8 | Beijing | 1,488,755 | 106,120,339 | -6.6% | 37.4% |
| 9 | Hubei | 3,183,403 | 83,093,451 | 20.1% | 28.0% |
| 10 | Fujian | 18,134,477 | 76,153,179 | 20.5% | 19.0% |
The mainly goods delivered places of China pumps include Guangdong, Jiangsu and Zhejiang.
The Export Analysis of China Centrifuges, Filtering or Purifying Machinery during Jan. - Jun. 2013
The Export Volume and Value of China Centrifuges, Filtering or Purifying Machinery during Jan. - Jun. 2013
| Months | Volume(-) | Value(One hundred million U.S. dollars) | Compared with the same period of last year | |
|
|
|
| Volume | Value |
| Jan. | 62,816,509 | 3.70 | 9.7% | 22.7% |
| Feb. | 48,053,879 | 2.90 | 45.4% | 31.8% |
| Mar. | 50,175,839 | 3.36 | -9.5% | 16.2% |
| Apr. | 62,323,834 | 3.89 | 8.6% | 31.5% |
| May | 69,066,468 | 3.80 | 5.6% | 13.5% |
| Jun. | 63,624,346 | 3.56 | 1.1% | 3.5% |
| Total | 356,060,875 | 21.21 | 7.4% | 18.8% |
The export value of China centrifuges, filtering or purifying machinery reached $ 2.12 billion during Jan. - Jun. 2013, which increased 18.8%.
Mainly Export Countries/Regions of China Centrifuges, Filtering or Purifying Machinery between Jan. – Jun. of 2013
| No. | Country | Volume(-) | Value(USD) | Compared with the same period of last year | |
|
|
|
|
| Volume | Value |
| 1 | USA | 61,843,899 | 305,911,839 | -6.0% | 8.8% |
| 2 | Japan | 18,286,604 | 246,315,331 | -14.4% | 14.2% |
| 3 | India | 22,875,356 | 101,772,201 | 18.6% | 6.9% |
| 4 | Italy | 10,211,069 | 74,871,234 | -3.1% | 2.5% |
| 5 | HK | 3,945,147 | 73,501,507 | -18.7% | -19.8% |
| 6 | Australia | 7,929,669 | 69,245,009 | 9.9% | 115.9% |
| 7 | Indonesia | 8,651,669 | 64,369,669 | 69.0% | 39.4% |
| 8 | Korea | 4,036,477 | 56,584,412 | 3.8% | 8.5% |
| 9 | Russia | 8,283,953 | 55,740,033 | 9.5% | 46.7% |
| 10 | Germany | 10,191,343 | 55,371,211 | 31.5% | 10.2% |
| 11 | Malaysia | 9,952,469 | 52,912,694 | 40.8% | 45.2% |
| 12 | Brazil | 8,078,860 | 52,662,897 | -5.2% | 29.6% |
| 13 | Vietnam | 5,135,361 | 51,054,905 | 28.4% | 28.7% |
| 14 | Thailand | 6,120,964 | 49,148,282 | 11.4% | 18.7% |
| 15 | Turkmenistan | 553,426 | 48,953,771 | 378.9% | 84.8% |
| 16 | Turkey | 8,033,724 | 46,542,348 | 32.2% | 139.2% |
| 17 | Taiwan | 7,927,488 | 45,187,535 | -2.7% | 15.4% |
| 18 | Kazakhstan | 2,857,135 | 42,667,203 | 55.7% | 140.9% |
| 19 | Singapore | 4,156,979 | 32,237,522 | -8.4% | 1.2% |
| 20 | UAE | 10,311,919 | 28,649,084 | -3.1% | -5.6% |
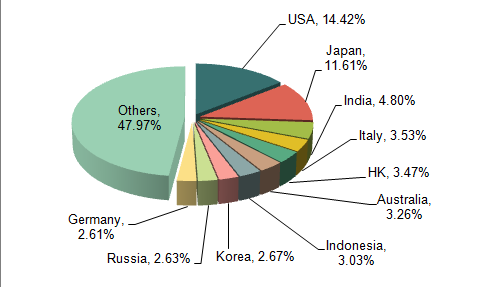
At the first half year of 2013, Australia took the bigger increased growth for China export value of centrifuges, filtering or purifying machinery at top 20 countries, which increased 115.9%. The second is Turkey with 139.2% growth. The third is Kazakhstan, which increased 140.9% as before.
The Goods Delivered Places of China Centrifuges, Filtering or Purifying Machinery between Jan. - Jun. 2013
| No | Regions | Volume(-) | Value(USD) | Compared with the same period of last year | |
|
|
|
|
| Volume | Value |
| 1 | Guangdong | 71,809,117 | 426,021,951 | 12.0% | 28.5% |
| 2 | Shanghai | 51,898,292 | 418,676,142 | 3.2% | 16.3% |
| 3 | Zhejiang | 126,603,500 | 339,771,218 | 10.2% | 23.3% |
| 4 | Jiangsu | 35,873,467 | 286,329,092 | 15.9% | -0.6% |
| 5 | Shandong | 14,762,237 | 121,858,668 | -2.3% | 23.1% |
| 6 | Beijing | 5,024,571 | 109,216,276 | 6.9% | 47.9% |
| 7 | Sichuan | 3,995,210 | 73,201,266 | -9.6% | 64.9% |
| 8 | Fujian | 7,938,872 | 70,565,707 | -11.4% | 27.2% |
| 9 | Anhui | 13,516,071 | 49,361,482 | 48.9% | 24.1% |
| 10 | Hebei | 9,945,081 | 41,873,303 | 16.2% | 24.2% |
Mainly goods delivered places for China centrifuges, filtering or purifying machinery include Guangdong, Shanghai, Zhejiang and Jiangsu.
The Export Analysis of China Boiler Shells, Tanks and Vats between Jan. - Jun. 2013
The Export Volume and Value of China Boiler Shells, Tanks and Vats between Jan. - Jun. 2013
| Months | Volume(-) | Value(One hundred million U.S. dollars) | Compared with the same period of last year | |
|
|
|
| Volume | Value |
| Jan. | 354,288,917 | 11.84 | 13.2% | 4.2% |
| Feb. | 259,502,380 | 8.92 | 62.1% | 54.0% |
| Mar. | 278,677,548 | 8.61 | -6.4% | -18.7% |
| Apr. | 331,197,237 | 11.05 | 5.4% | 0.3% |
| May | 370,547,228 | 12.34 | -0.4% | -2.6% |
| Jun. | 327,677,302 | 11.53 | 6.4% | -4.4% |
| Total | 1,921,890,612 | 64.27 | 8.9% | 1.3% |
The export value reached $ 6.43 billion at first half year of 2013, which increased 1.3% as before.
Mainly Import Country/Region of China Boiler Shells, Tanks and Vats between Jan. - Jun. 2013
| No. | Country | Volume(-) | Value(USD) | Compared with the same period of last year | |
|
|
|
|
| Volume | Value |
| 1 | USA | 321,410,656 | 1,536,058,970 | 4.1% | -0.7% |
| 2 | Japan | 48,196,944 | 315,616,730 | -1.5% | -12.2% |
| 3 | Germany | 55,211,534 | 288,293,460 | -6.5% | -2.0% |
| 4 | Russia | 88,268,597 | 253,119,893 | 81.6% | 5.6% |
| 5 | UK | 64,035,453 | 251,949,692 | -1.3% | -1.1% |
| 6 | Italy | 51,235,199 | 189,455,394 | 52.6% | -3.4% |
| 7 | Korea | 69,619,144 | 188,445,517 | 6.5% | 1.4% |
| 8 | HK | 35,228,615 | 150,350,877 | 56.4% | 11.2% |
| 9 | Canada | 18,522,074 | 144,496,827 | -13.7% | -21.0% |
| 10 | Spain | 29,471,970 | 133,600,147 | 1.6% | -13.6% |
| 11 | Indonesia | 134,482,708 | 131,083,904 | 1.2% | 20.2% |
| 12 | India | 63,677,372 | 126,770,391 | 4.9% | -10.9% |
| 13 | USA | 34,880,060 | 126,302,793 | 10.6% | 16.1% |
| 14 | France | 85,443,309 | 126,217,952 | 106.2% | -12.3% |
| 15 | Australia | 18,495,091 | 126,054,174 | -7.2% | 3.3% |
| 16 | Malaysia | 28,445,552 | 115,606,079 | 23.6% | 25.7% |
| 17 | Taiwan | 44,296,006 | 112,745,062 | 27.3% | 3.3% |
| 18 | Thailand | 79,183,434 | 111,861,252 | 3.1% | 4.2% |
| 19 | Netherland | 18,137,581 | 108,018,936 | -27.2% | 5.2% |
| 20 | Mexico | 37,501,648 | 106,894,324 | -0.3% | 4.4% |
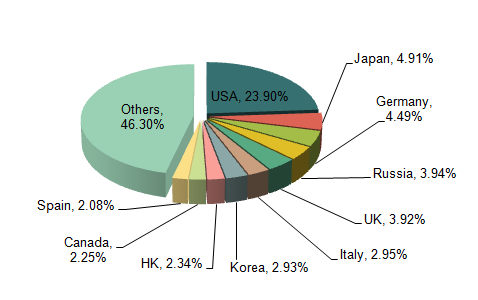
Mainly import countries & Regions of China boiler shells, tanks and vats at first half of 2013 include USA, Japan, Germany, Russia, UK, Italy, Korea, HK, Canada and Spain.
The Goods Delivered Places of China Boiler Shells, Tanks and Vats between Jan. - Jun. 2013
| No. | Regions | Volume(-) | Value(USD) | Compared with the same period of last year | |
|
|
|
|
| Volume | Value |
| 1 | Zhejiang | 888,340,768 | 2,350,976,203 | 4.9% | 2.1% |
| 2 | Guangdong | 147,824,903 | 973,801,851 | 23.9% | 5.3% |
| 3 | Jiangsu | 295,487,462 | 856,402,078 | 1.6% | -6.5% |
| 4 | Fujian | 201,745,305 | 640,463,277 | 2.8% | 16.8% |
| 5 | Shanghai | 110,314,700 | 416,000,872 | -5.0% | -11.1% |
| 6 | Shandong | 163,176,159 | 266,849,589 | 112.8% | -9.5% |
| 7 | Tianjin | 11,502,301 | 187,128,714 | -5.1% | 9.6% |
| 8 | Liaoning | 25,367,886 | 182,775,261 | -11.3% | -12.3% |
| 9 | Beijing | 5,179,222 | 124,794,422 | 3.9% | -8.6% |
| 10 | Hebei | 39,442,448 | 122,974,999 | -3.9% | 5.3% |
Mainly goods delivered places of China boiler shells, tanks and vats are Zhejiang, Guangdong and Jiangsu.
The Export Analysis of China Ball or Roller Bearings between Jan. - Jun. 2013
The Export Volume and Value of China Ball or Roller Bearings between Jan. - Jun. 2013
| Months | Volume(-) | Value(One hundred million U.S. dollars) | Compared with the same period of last year | |
|
|
|
| Volume | Value |
| Jan. | 428,761,494 | 3.73 | -3.6% | -5.6% |
| Feb. | 293,401,228 | 2.73 | 40.2% | 23.9% |
| Mar. | 329,960,821 | 3.46 | -18.1% | -7.7% |
| Apr. | 420,504,054 | 3.88 | 1.7% | 6.4% |
| May | 461,101,360 | 4.26 | 1.9% | 7.0% |
| Jun. | 424,329,334 | 3.67 | 4.5% | -0.2% |
| Total | 2,358,058,291 | 21.74 | 1.3% | 2.5% |
The export value of china ball or roller bearings reached $ 2.17 billion at the first half of 2013, which increased 2.5%.
The Import Countries/Regions of China Ball or Roller Bearings between Jan. - Jun. 2013
| No. | Country | Volume(-) | Value(USD) | Compared with the same period of last year | |
|
|
|
|
| Volume | Value |
| 1 | USA | 277,666,362 | 303,757,924 | 1.3% | -4.4% |
| 2 | India | 248,826,893 | 165,250,527 | 7.6% | 3.1% |
| 3 | Vietnam | 87,592,560 | 143,881,963 | 46.8% | 174.3% |
| 4 | Korea | 155,169,580 | 137,281,800 | 5.2% | -4.2% |
| 5 | Germany | 176,686,228 | 128,487,101 | 2.5% | -8.9% |
| 6 | Japan | 148,581,639 | 126,367,535 | -8.8% | -9.8% |
| 7 | Italy | 91,801,415 | 108,301,413 | -2.0% | 9.2% |
| 8 | Brazil | 114,433,009 | 81,459,388 | 14.0% | 6.7% |
| 9 | France | 39,339,803 | 67,414,217 | 16.2% | -2.2% |
| 10 | Malaysia | 52,387,910 | 65,585,205 | 3.9% | 13.0% |
| 11 | HK | 173,502,445 | 65,554,449 | 2.5% | -1.3% |
| 12 | Indonesia | 77,319,957 | 60,852,022 | 33.0% | 28.9% |
| 13 | Singapore | 44,112,510 | 54,106,385 | -22.0% | -2.7% |
| 14 | Taiwan | 88,081,965 | 52,689,098 | -0.1% | 11.4% |
| 15 | Thailand | 52,981,356 | 49,447,643 | -15.2% | -4.9% |
| 16 | UAE | 50,978,464 | 42,725,831 | -23.1% | -24.4% |
| 17 | Mexico | 25,163,134 | 37,477,787 | 19.0% | 31.4% |
| 18 | Canada | 18,230,490 | 28,482,844 | -9.5% | -7.7% |
| 19 | Kazakhstan | 4,761,497 | 26,129,738 | 64.8% | 86.8% |
| 20 | Netherland | 28,899,268 | 24,052,397 | -2.4% | -0.4% |
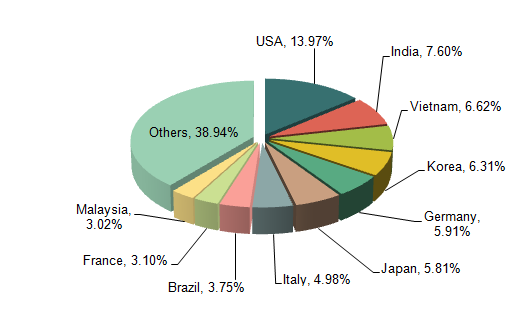
At the first half year of 2013, Vietnam took the bigger increased growth for China export value of ball or roller bearings at top 20 countries, which increased 174.3%. The second is Kazakhstan with 86.8% growth as before.
The Goods Delivered Places of China Ball or Roller Bearings between Jan. - Jun. 2013
| No. | Regions | Volume(-) | Value(USD) | Compared with the same period of last year | |
|
|
|
|
| Volume | Value |
| 1 | Zhejiang | 1,177,276,642 | 680,362,540 | 0.9% | -4.5% |
| 2 | Jiangsu | 400,523,241 | 439,809,203 | 4.7% | -1.0% |
| 3 | Shanghai | 394,670,609 | 264,371,703 | -6.8% | -10.8% |
| 4 | Guangdong | 96,979,105 | 234,039,114 | 67.6% | 138.8% |
| 5 | Shandong | 118,379,840 | 180,709,512 | 25.7% | -0.1% |
| 6 | Liaoning | 23,072,488 | 110,314,994 | -24.5% | -4.7% |
| 7 | Hebei | 36,055,858 | 40,297,613 | -8.2% | 3.6% |
| 8 | Xinjiang | 3,715,292 | 27,686,536 | 6.4% | 64.8% |
| 9 | Fujian | 22,108,045 | 27,424,778 | -23.8% | -18.3% |
| 10 | Sichuan | 6,977,103 | 26,720,531 | -16.9% | -2.2% |
Mainly goods delivered places of China ball or roller bearings include zhejiang, jiangsu and shanghai. At top 20 goods delivered places, Guangdong took the biggest export at the first half year of 2013, which increased 138.8%.
The Export Analysis of China Electric Generating Sets and Rotary Converters between Jan. - Jun. 2013
The Export Volume and Value of China Electric Generating Sets and Rotary Converters between Jan. - Jun. 2013
| Months | Volume(Unit) | Value(One hundred million U.S. dollars) | Compared with the same period of last year | |
|
|
|
| Volume | Value |
| Jan. | 957,848 | 3.12 | -0.3% | 2.9% |
| Feb. | 707,501 | 2.71 | 24.4% | 18.2% |
| Mar. | 848,406 | 3.54 | -14.7% | -2.6% |
| Apr. | 1,059,627 | 3.73 | 12.7% | 22.2% |
| May | 1,151,078 | 4.18 | 12.2% | 9.8% |
| Jun. | 1,204,196 | 4.17 | 26.1% | 7.8% |
| Total | 5,928,656 | 21.45 | 8.9% | 8.9% |
The export value of China electric generating sets and rotary converters reached $ 2.15 billion at the first half year of 2013, which increased 8.9% as before.
Mainly Import Countries/Regions of China Electric Generating Sets and Rotary Converters between Jan. - Jun. 2013
| No. | Country | Volume(Unit) | Value(USD) | Compared with the same period of last year | |
|
|
|
|
| Volume | Value |
| 1 | USA | 931,584 | 304,234,534 | 50.7% | 15.9% |
| 2 | Indonesia | 336,934 | 145,584,028 | 10.3% | -8.8% |
| 3 | Nigeria | 810,175 | 118,778,660 | -10.3% | -3.3% |
| 4 | UAE | 554,641 | 117,803,451 | -25.2% | -19.2% |
| 5 | Pakistan | 434,854 | 107,462,967 | 25.8% | 11.9% |
| 6 | South Africa | 96,642 | 89,784,824 | -1.5% | 309.9% |
| 7 | Russia | 186,067 | 67,982,452 | 63.0% | 13.8% |
| 8 | Angola | 297,347 | 64,814,135 | 24.8% | 15.8% |
| 9 | Saudi Arabia | 19,473 | 58,429,062 | -4.9% | 25.1% |
| 10 | Australia | 46,566 | 54,935,215 | -7.2% | 17.3% |
| 11 | Egypt | 315,235 | 50,478,923 | 702.3% | 688.8% |
| 12 | Peru | 14,617 | 48,559,975 | -31.4% | 419.6% |
| 13 | Turkey | 61,642 | 44,963,537 | 43.1% | 7.1% |
| 14 | Philippines | 35,583 | 41,921,303 | 2.1% | 17.1% |
| 15 | Iraq | 83,112 | 35,781,776 | -66.7% | -41.3% |
| 16 | Ecuador | 6,867 | 34,971,744 | 34.6% | 128.5% |
| 17 | HK | 6,264 | 32,576,828 | 5.9% | -15.1% |
| 18 | Italy | 30,063 | 31,396,746 | -34.4% | 180.2% |
| 19 | Singapore | 3,843 | 26,492,804 | -61.4% | -23.8% |
| 20 | Mexico | 39,551 | 26,125,767 | 27.0% | 44.1% |
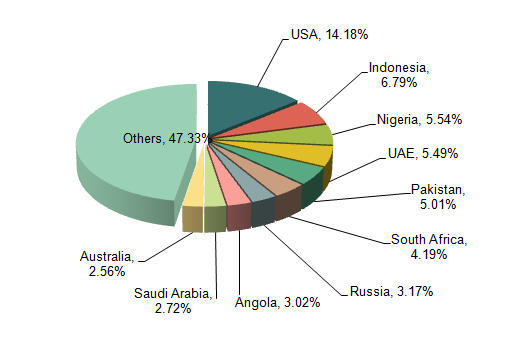
At the first half year of 2013, South Africa took the bigger increased growth for China export value of electric generating sets and rotary converters at top 20 countries, which increased 309.9%. The next four countries include Egypt ( with 688.8% growth as before), Peru (with 419.6% growth as before), Ecuador (with 128.5% growth as before) and Italy (with 180.2% growth as before).
Egypt got a hot summer at 2013, and the demand of electric power got a big increasing. In order to avoid power interruption happened, the number of electric generating sets raised rapidly, and caused the cost of power sets took a 60% growth. It does not matter with USD appreciation.
The Goods Delivered Places of China Electric Generating Sets and Rotary Converters between Jan. - Jun. 2013
| No. | Regions | Volume(Unit) | Value(USD) | Compared with the same period of last year | |
|
|
|
|
| Volume | Value |
| 1 | Jiangsu | 1,408,877 | 569,835,816 | -2.1% | 21.3% |
| 2 | Zhejiang | 1,881,799 | 329,728,046 | 10.4% | 6.8% |
| 3 | Chongqing | 1,194,478 | 320,825,914 | 46.9% | 58.1% |
| 4 | Fujian | 1,166,694 | 271,396,194 | -6.3% | -3.0% |
| 5 | Tianjin | 6,130 | 155,550,206 | 106.3% | 43.2% |
| 6 | Shanghai | 216,019 | 141,302,354 | 12.1% | -24.6% |
| 7 | Guangdong | 17,512 | 117,678,763 | 18.6% | -21.2% |
| 8 | Shandong | 8,684 | 72,615,882 | 47.7% | -12.8% |
| 9 | Shanxi | 136 | 39,968,589 | -19.5% | 341.3% |
| 10 | Beijing | 949 | 30,862,002 | -24.6% | -49.0% |
The goods delivered places of china electric generating sets and rotary converters include Jiangsu, Zhejiang and Chongqing. At top 20 goods delivered places, Shanxi took the biggest export at the first half year of 2013, which increased 341.3%.
The Export Analysis of China Welding Machines between Jan. - Jun. 2013
The Export Volume and Value of China Welding Machines between Jan. - Jun. 2013
| Month | Volume(-) | Value(One hundred million U.S. dollars) | Compared with the same period of last year | |
|
|
|
| Volume | value |
| Jan. | 4,553,778 | 1.19 | -5.8% | 14.9% |
| Feb. | 3,513,662 | 0.92 | 75.0% | 70.3% |
| Mar. | 3,250,470 | 0.90 | -25.0% | -5.5% |
| Apr. | 4,777,856 | 1.09 | 3.9% | 14.2% |
| May | 4,810,679 | 1.22 | -13.5% | -3.8% |
| Jun. | 4,679,847 | 1.12 | -4.0% | -12.8% |
| Total | 25,586,292 | 6.44 | -2.4% | 6.7% |
The export value of China welding machines reached $ 640 million at the first half year of 2013, which increased 6.7% as before.
The Import Countries/Regions of China Welding Machines between Jan. - Jun. 2013
| No. | Country | Volume(-) | Value(USD) | Compared with the same period of last year | |
|
|
|
|
| Volume | Value |
| 1 | Russia | 2,597,104 | 97,526,089 | 37.2% | 101.6% |
| 2 | USA | 2,047,631 | 44,257,186 | -22.4% | -7.4% |
| 3 | Indonesia | 1,549,928 | 37,803,762 | -20.8% | 54.2% |
| 4 | Thailand | 1,187,666 | 32,891,681 | 31.1% | 3.9% |
| 5 | Japan | 431,434 | 25,866,422 | -24.9% | 6.1% |
| 6 | India | 763,396 | 21,630,888 | 72.6% | -16.1% |
| 7 | Ukraine | 405,164 | 20,573,852 | -34.8% | -44.8% |
| 8 | Brazil | 1,037,321 | 18,879,628 | -14.2% | 42.3% |
| 9 | Kazakhstan | 100,188 | 17,500,705 | 38.6% | 219.7% |
| 10 | Germany | 869,093 | 17,047,395 | -8.4% | -27.2% |
| 11 | Australia | 331,696 | 16,985,366 | -6.9% | 5.6% |
| 12 | Vietnam | 210,152 | 14,801,883 | -7.0% | -24.6% |
| 13 | HK | 1,378,053 | 14,711,493 | -0.1% | -24.7% |
| 14 | UAE | 622,877 | 14,517,953 | 16.4% | 0.3% |
| 15 | Malaysia | 935,069 | 13,679,117 | -9.9% | -11.0% |
| 16 | Korea | 399,741 | 13,074,334 | -0.6% | 4.8% |
| 17 | UK | 475,845 | 12,759,057 | 1.5% | 16.3% |
| 18 | South Africa | 331,851 | 12,274,751 | 11.1% | 29.0% |
| 19 | Poland | 506,503 | 12,145,357 | -0.4% | 6.7% |
| 20 | Turkey | 388,213 | 10,323,225 | -8.2% | 29.0% |
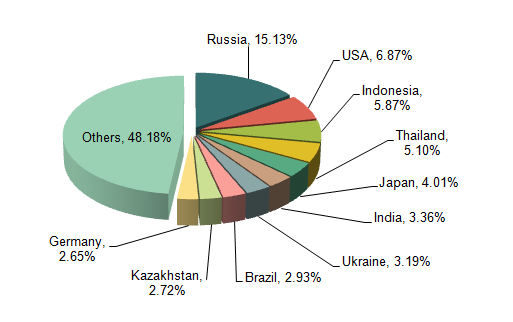
At the first half year of 2013, Russia took the bigger increased growth for China export value of welding machines at top 20 countries, which increased 101.6%. The second is Kazakhstan with 219.7% growth as before.
With background of the global economic crisis shadow has not yet subsided, Kazakhstan macroeconomic remained relatively and positive development the first half of 2013 although the external risk is still exist.
Industry: Kazakhstan industrial production increased 1.8% during the first half of 2013, industrial output value reached 8.7 trillion tenge, with an growth of 8.8%. Among them, the mining industry output reached 5.3 trillion tenge with an 4% growth which took 60.9% of total industrial output value; processing manufacturing output reached 2.8 trillion with 16.7% up, which took 32.2% of total industrial output value. At the first half of 2013, Kazakhstan produced 54.68 million tons of coal, 40.37 million tons of oil and natural gas 20.8 billion cubic meters.
Agriculture: The agricultural output value reached 510 billion tenge at the first half year of 2013 with an 1.4% growth. Among them, farming output value reached 8.8 billion tenge, animal husbandry output reached value of 500 billion. Up the end of June 2013, Kazakhstan has 4.96 million tons of grain and legume crops in domestic, 6.97 million head of cattle, 19,910,000 sheep, 1,330,000 pigs and poultry 37,790,000.
Construction: The construction output value reached 788.4 billion tenge during the first half of 2013 with an increase of 4.4%. And the residential area reached 2,910,000 square kilometers.
Fixed assets investment: the investment of fixed assets reached 2.3 trillion tenge with a 7.9% growth. Among them, Manufacturing fixed asset investment is accounted for 12.2% of whole fixed assets investment, increased 2.2% compared with the same period of 2012; agriculture fixed asset investment took in whole fixed assets investment of 2.2%, dropped 0.5% compared with the same period of 2012.
Domestic Trade: Kazakhstan domestic retail output value reached 2.2 trillion tenge at the first half of 2013 with an increase of 15.8%.
Import & Export Trade: Kazakhstan main export products include oil, coal, natural gas, metals, wheat and other products, it is easy to be influenced by the external environment.
As the international market commodity prices dropped down and external demand reduced, the Kazakhstan's mainly foreign trade indicators have deteriorated to varying degrees beginning at 2013. At the first half of 2013, Kazakhstan's foreign trade reached $ 63.5 billion with a 1.8% down. Among them, export value took $ 40.8 billion with a 7.1% down and imports reached 22.7 billion U.S. dollars with an increase of 9.4%.
The main import countries of Kazakhstan products include Italy (16.4% of total exports accounted for Kazakhstan), China (15.8%) and the Netherlands (14.2%); The major importation partners are Russia (accounting for 38% of Kazakhstan's total imports), China (16.9%) and Ukraine (4.9%).
The Goods Delivered Places of China Welding Machines between Jan. - Jun. 2013
| No. | Region | Volume(-) | Value(USD) | Compared with the same period of last year | |
|
|
|
|
| Volume | Value |
| 1 | Zhejiang | 13,406,652 | 172,576,116 | -6.2% | 13.8% |
| 2 | Guangdong | 3,286,418 | 125,794,003 | 10.8% | 7.2% |
| 3 | Shanghai | 2,521,630 | 111,215,087 | 3.4% | 5.9% |
| 4 | Jiangsu | 4,082,229 | 97,916,278 | 7.7% | -9.6% |
| 5 | Shandong | 862,015 | 43,899,240 | -2.2% | 7.5% |
| 6 | Hebei | 306,519 | 32,464,301 | 1.0% | 111.9% |
| 7 | Beijing | 190,404 | 16,973,458 | 117.6% | 9.6% |
| 8 | Shanxi | 541 | 9,144,278 | -99.0% | 249.6% |
| 9 | Tianjin | 133,614 | 5,705,901 | -46.9% | -22.9% |
| 10 | Liaoning | 70,828 | 4,648,821 | -48.3% | -32.3% |
The goods delivered places of china electric generating sets and rotary converters include Guangdong, Zhejiang and Shanghai. At top 20 goods delivered places, Hebei and Shanxi took the biggest export value at the first half year of 2013, which increased 111.9% and 249.6.
Data Source: China Custom


