China Quartz Export Volume and Value, from Jan. to Dec. 2013
| Month | Volume (Kg) | Value (USD) | Year-on-Year | |
| Volume | Value | |||
| Jan. | 35,114,635 | 2,994,134 | 29.8% | 23.4% |
| Feb. | 29,232,489 | 2,225,062 | 115.9% | 52% |
| Mar. | 24,620,690 | 2,523,731 | -1.1% | 12% |
| Apr. | 30,116,789 | 2,926,093 | 4.6% | 28.3% |
| May | 20,768,971 | 2,670,145 | -2.1% | 7.3% |
| Jun. | 25,137,282 | 2,172,193 | -8.3% | -19.3% |
| Jul. | 12,064,153 | 1,853,651 | -51.5% | -19.5% |
| Aug. | 10,377,631 | 2,251,845 | -39.7% | 5.9% |
| Sept. | 14,153,241 | 2,301,201 | -50.4% | -7.5% |
| Oct. | 18,216,825 | 2,506,409 | -26.7% | 9.2% |
| Nov. | 18,496,496 | 3,129,134 | -11% | 12.3% |
| Dec. | 16,949,627 | 3,928,894 | -35.4% | 40.3% |
| Total | 255,248,829 | 31,482,492 | -10.6% | 10.9% |
The export volume of Chinese quartz was 25.52 thousand tons, from Jan. to Dec. 2013, declined 10.6% year on year; the export value was 31.4825 million dollars, increased 10.9% year on year.
China Quartz Major Export Countries/Regions Distribution, from Jan. to Dec. 2013
| No. | Countries | Volume (Kg) | Value (USD) | Year-on-Year | ||
| Volume | Value | |||||
| 1 | Republic of Korea | 96,429,098 | 7,053,770 | -28.8% | -6.2% | |
| 2 | Japan | 16,793,274 | 3,694,650 | -27.5% | -26.4% | |
| 3 | Thailand | 14,170,994 | 2,860,544 | -0.2% | 14.5% | |
| 4 | USA | 4,696,076 | 2,828,380 | 15.5% | 40.6% | |
| 5 | Indonesia | 32,379,659 | 2,594,580 | -28.4% | -35.3% | |
| 6 | Taiwan | 42,456,917 | 1,447,238 | 70.7% | 24.1% | |
| 7 | Malaysia | 4,583,005 | 1,271,951 | 12.1% | 182.9% | |
| 8 | Nigeria | 8,736,044 | 1,062,653 | 448.5% | 565.5% | |
| 9 | Viet Nam | 2,465,709 | 1,011,843 | -40.3% | 37.6% | |
| 10 | Hong Kong | 882,161 | 841,125 | -55.9% | 79.9% | |
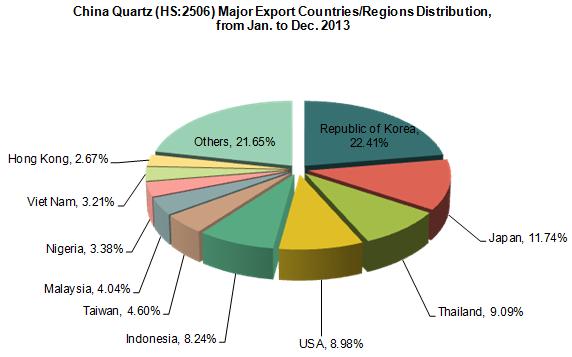
The largest export market for Chinese quartz was Korea. The total export value to Korea was 7.0538 million dollars, from Jan. to Dec. 2013, with a decrease of 6.2% year on year. Among the total export value of quartz, it accounted for 22.41%, followed by Japan, which accounted for 11.74%.
Among the top ten export countries/ regions, from Jan. to Dec. 2013, the largest increase of volume and value were both in Nigeria, increased 448.5% in volume and 565.5% in value year on year.
China Quartz Original Places of Exported Goods, from Jan. to Dec. 2013
| No. | Regions | Volume (Kg) | Value (USD) | Year-on-Year | |
| Volume | Value | ||||
| 1 | Guangdong | 26,141,685 | 9,747,299 | -25.1% | 37.5% |
| 2 | Jiangsu | 54,366,393 | 8,256,944 | 3.5% | -4.8% |
| 3 | Shandong | 104,038,304 | 3,456,983 | -24% | -20.8% |
| 4 | Henan | 28,206,595 | 2,668,400 | 12% | 12.8% |
| 5 | Hubei | 17,512,023 | 2,324,962 | 211.2% | 92.3% |
| 6 | Fujian | 8,151,576 | 1,125,926 | -25.3% | -6.1% |
| 7 | Liaoning | 5,797,320 | 769,485 | -33.1% | -15.8% |
| 8 | Tianjin | 3,326,953 | 708,127 | 20.2% | 9% |
| 9 | Hebei | 2,118,178 | 518,063 | -25.8% | -20% |
| 10 | Jiangxi | 884,408 | 340,859 | 438.8% | 664.6% |
The major quartz original places in China are Guangdong, Jiangsu and Shandong. From Jan. to Dec. 2013, the export volume of the above three provinces accounted for 72.3% of the total export volume, and the export value of the three provinces accounted for 68.17% of the total export value


